
How to Write Better Code with Static Code Analyzers

Many years ago, when I thought – inexperienced and naive as I was – that I was a much better programmer than I was back then, someone asked me: "Sven, how many lines of code has your longest method?" Neither did I know the answer to the question, nor did I understand its background. Today I can answer the question instantly: 50! We ensure this with Checkstyle (more on this below), and it is essential because all (without exception!) of our methods fit on the screen without scrolling and so their functionality can be captured very quickly.
In the first part of this article series on Static Code Analysis, I listed the following qualitative goals for software development:
- Enforcing a consistent code style within the team
- Developing readable and maintainable code
- Developing code that is as bug-free as possible
- Minimizing security vulnerabilities in the software
Traditionally, IT teams try to come as close as possible to these goals through regular code reviews. This part of the series explains how Static Code Analysis can help achieve these goals.
How Static Code Analysis can help
According to the four goals mentioned above, we can divide the tasks for static code analysis tools into the following categories:
- Verification of code standards
- Calculation of software metrics
- Detection of errors in the code
- Detection of security vulnerabilities
An additional cross-cutting aspect is progress monitoring, that is, the storage of metrics of different tools over time. Monitoring allows a team to trace whether the code quality improves or deteriorates according to the configured aspects.
In the following sections, I will go into the categories in detail.
Verifying code standards
Tools in this category verify that the source code meets pre-defined and configured code formatting requirements. It can check aspects such as parenthesis, indentation, line width, spaces and blank lines, class and method lengths, number of method parameters, and much more.
Why is a consistent code standard relevant?
A consistent code standard has the following advantages:
- Uniformly formatted code is easier to read and understand.
- If all developers write directly in a consistent style, reviews are faster because the code doesn't have to be adapted to the commonly agreed rules first.
- Code that is difficult to read and therefore difficult to understand can lead to errors and security risks.
Which code standards exist?
Modern IDEs can format code on their own. Formatting rules integrated into the IDE can be used, adapted, exported, and imported. The standard code styles integrated with Eclipse and IntelliJ, however, are different. Eclipse has the "Java Conventions," "Eclipse," and "Eclipse 2.1" styles; IntelliJ offers the "Default" style.
IntelliJ can import formatting rules exported by Eclipse, while the other way around, this is not possible. Since IntelliJ, even with an imported Eclipse format, does not generate 100% identical code as Eclipse, you can install the Eclipse Code Formatter plugin, which formats the code in IntelliJ in the same way as Eclipse does.
The "Java Conventions" from Eclipse correspond to the Java Code Conventions published by Sun in 1997 – and last revised in 1999. Accordingly, this style does not know any newer language elements such as Generics or Lambdas.
A modern and widely used IDE-independent code style is Google Java Style, which is used in many projects either directly or slightly modified. Google Style has the following advantages:
- Google provides configuration files for Eclipse, IntelliJ and Checkstyle (more on this below).
- Not only Java but also many other common languages like HTML, CSS, and JavaScript are available. Thus, in a project which uses different languages, a consistent style can be applied comfortably.
To demonstrate the differences, I have formatted the following (meaningless and intentionally improperly formatted) piece of code in all the previously mentioned code styles.
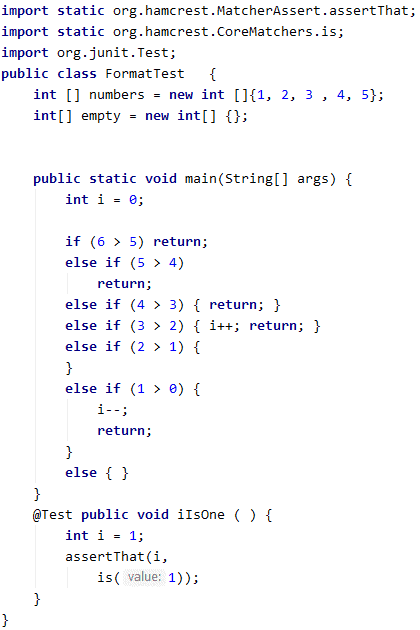
You can see the results in the following image gallery (click to enlarge). Since Google Java Style is indented with two spaces by default, I have added a variant with a four-space indentation.


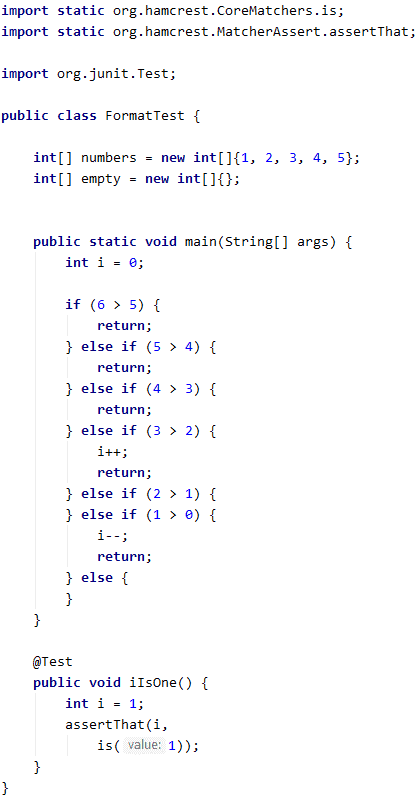
As you can see, all styles are quite similar. They all use a slightly modified variant of the so-called "One True Brace Style" (1TBS) or "Kernighan & Ritchie Style" (K&R): The opening curly bracket is located in the same line as the corresponding class or method definition, or control statement.
We see differences in details, such as:
- Whether in an array definition, spaces exist between the square brackets and the curly brackets or also within the curly brackets
- Whether curly braces around single statements are required or optional
- Whether single statements may appear in the same line after the control statement
- Whether blank lines are removed or inserted
It's precisely these details that interfere with the review, especially when you highlight code changes and then have to filter out the intended changes from the background noise of the many small formatting changes.
If you develop a custom style, it should differ only slightly from the popular styles, so that developers don't have to waste time getting used to it, and can understand the style as intuitively as possible. My preferred style is basically Google Style (primarily the required setting of curly braces around single statements) with the only difference that I indent by four spaces instead of two, as I am used to from the original Java Code Conventions.
How can Static Code Analysis enforce a consistent code standard?
Modern IDEs can format source code, but there are two limitations:
1. They cannot make sure that all coding specifications are met, for example, the following:
- The maximum method and class length
- The maximum number of "Non-Commenting Source Statements" in a method
- The maximum number of parameters of a method
- The maximum nesting depth of loops and control statements
2. They cannot ensure that all developers have enabled and correctly configured their formatters.
Static Code Analysis tools of the category "verification of code standards" are closing this very gap. Once the appropriate tools have been configured and integrated into the build pipeline, you can be sure that the same code style is used throughout the project and by all team members.
Tools for verifying the code standard
The most popular open-source tool is Checkstyle. It can be configured quite flexibly and adapted to all the above code styles. For Google Java Style, a Checkstyle configuration file is available for download. Checkstyle can also be integrated into the build process so that it issues warnings or aborts the process if developers violate the rules. I will discuss Checkstyle in more detail in the third part of this article series.
Computing software metrics
Software metrics are functions that express specific quality characteristics of software (such as maintainability, extensibility or comprehensibility) in an objective and comparable numerical value (e.g., "maintainability index," "cyclomatic complexity"). Software metrics can help developers and teams achieve quality goals. These tools are integrated into the build process to calculate software metrics and alert developers in case of deviations from pre-defined target values.
Which software metrics are available?
Some of the best-known metrics are the following:
Complexity metrics:
- Coupling: the degree of dependency between the modules of a system – a low coupling leads to better comprehensibility and maintainability
- Cohesion: the degree of dependencies within a software module – a high degree of cohesion leads to better comprehensibility and maintainability
- Average Component Dependency: the average number of component dependencies in a software system
- Circular dependencies: these correspond to a high coupling of the involved modules – none can be reused stand-alone – and developers cannot understand one without the others
- Cyclomatic complexity: the number of different paths through a software module – the higher the cyclomatic complexity, the harder it is to understand the software module
- Maintainability Index: a value resulting from the combination of specific other metrics
Metrics for code coverage / test coverage:
- Line coverage: this value indicates how many lines of code are covered by automatic tests compared to the total number of lines of code
- Branch coverage: the ratio of the program flow paths covered by tests to the total possible flow paths
The following image shows the circular dependencies of a project I worked on:

Until we resolved the circular dependencies (by reassigning classes to other packages and applying the Dependency Inversion Principle), it was impossible to extract code parts into reusable modules. Also, it was tough for new team members to get used to certain code parts, as this required at least a rough understanding of all 63 packages.
Tools for calculating software metrics
The most popular open-source tools in this category are JaCoCo and Cobertura for measuring test coverage, Sonargraph Explorer for calculating and displaying (cyclic) dependencies and complexity metrics, and SonarQube for calculating metrics of complexity, maintainability, reliability, safety, and test coverage.
Detecting defects in code
Tools in this category try to find potential defects in the code by recognizing common error patterns. Examples are:
- Certain/potential
NullPointerExceptions - Comparing objects of different classes with
equals() - Classes implementing
equals(), but nothashCode()– or vice versa - Comparing strings with
==or!=(this is either a bug or – if intended – confusing for the next developer and therefore error-prone) switchstatements withoutdefaultoptionswitchstatements with "fall throughs" (these are confusing because the reader often does not know if they are intended)- Unused constructor or method parameters
- Unused local variables
- Unused private fields and methods
- Resources that are not (in all cases) closed
- Objects exposing mutable internal objects such as lists (instead of exposing copies or read-only proxies)
- Missing
assertstatements in unit tests
Static Code Analysis tools for bug detection are for example the Java compiler itself (with appropriate parameters), the open-source tools PMD, FindBugs and its successor SpotBugs, and SonarQube, which I will discuss in detail in the third part of this article series.
Detecting security vulnerabilities
Ultimately, security vulnerabilities in the software are caused by errors in the code. In contrast to the previous category, however, these are errors that are much more difficult to detect because they require complex data flow analyses: It is necessary to check how input data flows and is processed through the system and possibly also through external libraries, both via regular and extraordinary execution paths. Examples of security vulnerabilities are:
- Command and SQL Injection: Missing/insufficient verification of input values can lead to user input being interpreted by the software as (SQL) commands (e.g. "
; delete * from User;" – if this is sent to the database, unchanged as part of a query, the entire user table may be purged). - Access control errors so that unauthorized users can perform functions for which they are not authorized (e.g., reading private data from other users).
- Cross-site scripting: the introduction of malicious executable code, for example, via request parameters in a URL.
- Cross-site request forgery: a user who is logged in to a system clicks on a link through which he unconsciously carries out a harmful action (e.g. he could change his password to a one set by the attacker, after which the attacker could log in to the user account).
Relevant terms in connection with software security are:
- CWE – Common Weakness Enumeration: a list of common vulnerabilities, created by the developer community, in which each vulnerability has a unique identifier, such as CWE-77 for the above-mentioned "Command Injection" or CWE-89 for "SQL Injection." This list is not prioritized. It serves, so to speak, as a universal language: almost all software security tools specify the corresponding CWE identifier when vulnerabilities are detected.
- OWASP – Open Web Application Security Project: a non-profit organization dedicated to increasing software security. Their most famous project is the "OWASP Top 10" list, which lists the current ten most critical security risks of web applications (including their CWE classifications). The list was last updated in 2017.
- CWE/SANS Top 25 Most Dangerous Software Errors: an alternative list of the 25 most critical security vulnerabilities – though not updated since 2011.
These lists are prioritized and can, therefore, be used to prioritize the elimination of security vulnerabilities (see Rollout Strategy below).
OWASP Benchmark
Another OWASP project is the OWASP Benchmark. This free, open-source test suite checks how well a software security tool detects particular vulnerabilities, i.e., how many actual bugs it finds and – compared to that – how many false positives it reports. The OWASP benchmark helps to compare available security tools with each other and to evaluate them according to software security requirements.
Software vulnerability detection tools
In the open-source area, I know of Find Security Bugs, a FindBugs/SpotBugs plugin, and the above mentioned SonarQube. I will introduce both in the third part of the series. For applications with increased security requirements, you should consider using commercial tools. However, those are outside the scope of this article series.
Cross-cutting aspect: progress monitoring
The tools of all categories mentioned above provide numerical values for each run. These can be used to make quantitative statements about the quality of the software:
- The number of code style warnings or errors
- The number of tests and the number or percentage of lines of code covered by tests
- The number of duplicated code blocks of various lengths
- The number of circular dependencies between classes or packages
- Cyclomatic complexity
- The number of potential errors in the various categories
Special tools can store and display these metrics over time. They allow the development team to track how code quality changes over time. They also enable teams to set goals, such as increasing test coverage in period x by y percentage points or reducing cyclomatic complexity in period x by amount y.
The probably most famous open-source tool of this kind is the Community Edition of SonarQube, which not only – as mentioned above – can calculate code metrics, but also stores and visualizes them over time. Using plugins, SonarQube can import the metrics of other Static Code Analysis tools and also save their histories.
Rollout strategy
Ideally, development teams should integrate Static Code Analysis tools at the beginning of a project to avoid expensive refactoring at a later stage. Of course, you can also introduce these tools into existing projects. In order not to flood the developers with thousands of warning messages in the IDE and by build reports (the elimination of which is then postponed again and again due to the immense number), a rollout strategy should be worked out.
At AndroidPIT, we did the following: First, we installed all tools with the default settings and got a rough overview of the messages. Then the team decided which tools made sense and which did not. We switched off the ones that didn't make sense to us. If there were only a few warnings for certain types of errors, we fixed them immediately, as long as it wasn't too much effort. Then we prioritized what was left (still several thousand messages). We considered all safety-relevant messages first and prioritized them according to the OWASP Top 10 list. The team decided how to prioritize non-safety-relevant messages.
Then we disabled all the messages except the most prioritized category and gradually analyzed the remaining warnings and improved the code accordingly. In some cases, we did this in the context of tickets (especially with security risks); in others, team members worked through warnings when they needed a change from their regular tasks. Once we've fixed all warnings, we enabled the next most severe category and processed it again. In between, tool updates caused new warnings, which we then prioritized and temporarily disabled. We configured Jenkins in such a way that our projects were always stable despite existing warnings and were only marked as unstable if developers introduced new problems during development.
It took about a year for us to activate and subsequently remove all warnings.
Summary and outlook
This article has shown how the software development challenges listed in the first part can be solved using Static Code Analysis tools. In the third part, I will present the following Java tools in more detail (sorted alphabetically here):
- Checkstyle
- Cobertura
- FindBugs / SpotBugs
- Find Security Bugs
- JaCoCo
- PMD
- Sonargraph Explorer
- SonarLint
- SonarQube
Until then, happy coding!
Did you like the article and do you know someone also interested in the topic? Then I am happy if you share the article using one of the following buttons.