JDK Mission Control (JMC) is the graphical user interface for the Java Flight Recorder (JFR). JMC opens .jfr files or connects to running JVMs and starts recordings there. Its “Automated Analysis” checks a recording against 68 rules and tells you where to look first.
JMC is not part of the JDK; you have to download it separately. Older texts, such as JEP 283, still call it Java Mission Control – it is the same tool.
In the article on the Java Flight Recorder, I analyzed a recording with the jfr command and found five problems in it. Here, I analyze a recording of the same program in JMC.
In this article, you will learn:
- where to download JMC and which Java to start it with,
- how to open a recording or start one on a running JVM,
- how the JMC user interface is organized,
- what the Automated Analysis finds in the recording – and what it doesn’t,
- how to find the CPU load with the “Method Profiling” page and the flame graph,
- how to find allocations and a memory leak with the “Memory” and “Live Objects” pages,
- how to find waiting times with the “Lock Instances”, “Socket I/O”, and “Threads” pages,
- how to recognize exceptions as control flow with the “Exceptions” page,
- whether the garbage collector slows down the application,
- how to find custom events in the Event Browser,
- what the JMX Console shows on a running JVM,
- when to use
jfrand when to use JMC.
All screenshots were taken with JMC 9.1.2 on Linux; the analyzed recording comes from Java 27.
The Example: A Recording of Order Processing
I use the example program from the article on the Java Flight Recorder. Eight worker threads create random orders and process them. For each order, the program
- reads the quantity from a text field,
- checks whether the product is on a block list,
- requests the shipping cost from a shipping service via HTTP,
- gets the next invoice number,
- assembles the text of the receipt,
- and finally stores the receipt in a cache.
Five of these steps are deliberately written clumsily – the way you find them in code that has grown over time. These are the five problems we will look for with JMC:
- Quantities with a unit, e.g.,
"2 pcs", cause aNumberFormatExceptionwhen parsed. - The block list is an
ArrayListthat is searched element by element on every check. - The invoice number comes from a
synchronizedgenerator with a slow database access. - The receipt text is built by string concatenation in a loop.
- The cache has no upper bound.
You can find the code and an explanation of each method in the section The Example in This Article of the JFR article, and the complete code in the GitHub repository java-flight-recorder.
The following command line starts the program with a runtime of 70 seconds and a JFR recording:
$ java -XX:+UnlockDiagnosticVMOptions -XX:+DebugNonSafepoints \
       -XX:StartFlightRecording:name=orders,settings=profile \
       -cp target/classes eu.happycoders.jfr.OrderProcessing 70
After 62 seconds, I wrote the recording from the running JVM to a file with jcmd:
$ jcmd 82930 JFR.dump name=orders filename=orders.jfr path-to-gc-roots=trueThree options prepare the recording for the analysis:
settings=profile: The profiling settings record more events than the standard settings, at a typical overhead of about 2%.-XX:+DebugNonSafepoints: For the CPU profile, the profiling settings make the Flight Recorder read the stack traces of the threads currently executing Java code every 10 ms. With this option, these samples are attributed to the method that was actually running, even if the JIT compiler has embedded it into its caller (inlined it). The section Where Does the Application Spend CPU Time? of the JFR article shows where the samples end up without this option.path-to-gc-roots=true: The Flight Recorder determines the path from the GC root to the object for long-lived objects. JMC shows this path on the “Live Objects” page. The section What Is Holding On to Memory? of the JFR article shows that the Flight Recorder finds the path for considerably more objects when dumping from the running JVM than when the JVM exits.
Downloading and Starting JMC
JMC is an OpenJDK project, but not part of the JDK. Several vendors build it from source and offer it for download:
- jdk.java.net/jmc: This is where the builds of the OpenJDK project for Linux, macOS, and Windows are located.
- Adoptium: The Eclipse organization behind Temurin distributes JMC under the name Eclipse Mission Control.
- Azul: Azul offers JMC as Azul Mission Control, formerly Zulu Mission Control, in the current version 9.1.2.
- BellSoft: BellSoft offers only the older version 8.3 as Liberica Mission Control, and only for x86-64.
JMC itself is a Java application, built on the Eclipse Rich Client Platform. Version 9.1.2 from January 2026 requires Java 21 or newer to start.
The build from jdk.java.net does not come with its own Java but uses the Java found on the path. Use a JDK for this, not a pure runtime image – otherwise, JMC will not find the locally running JVMs. You select a specific JDK with the -vm option and the directory of the java command:
$ jmc -vm $JAVA_HOME/binBy the way, JMC records itself: its configuration file jmc.ini contains the option -XX:StartFlightRecording=name=JMC_Default,maxsize=100m.
Opening a Recording
JMC reads a recording in two ways: from a .jfr file or directly from a running JVM.
Opening a .jfr File
You open an existing .jfr file with “File > Open File…”. JMC reads the file, evaluates it with all rules of the Automated Analysis, and opens it in an editor tab.
Starting a Recording on a Running JVM
On the left of the window, the JVM Browser shows all JVMs running on the machine. Below each JVM is a “Flight Recorder” node. Right-click it and select “Start Flight Recording…” to open the “Start Flight Recording” wizard:
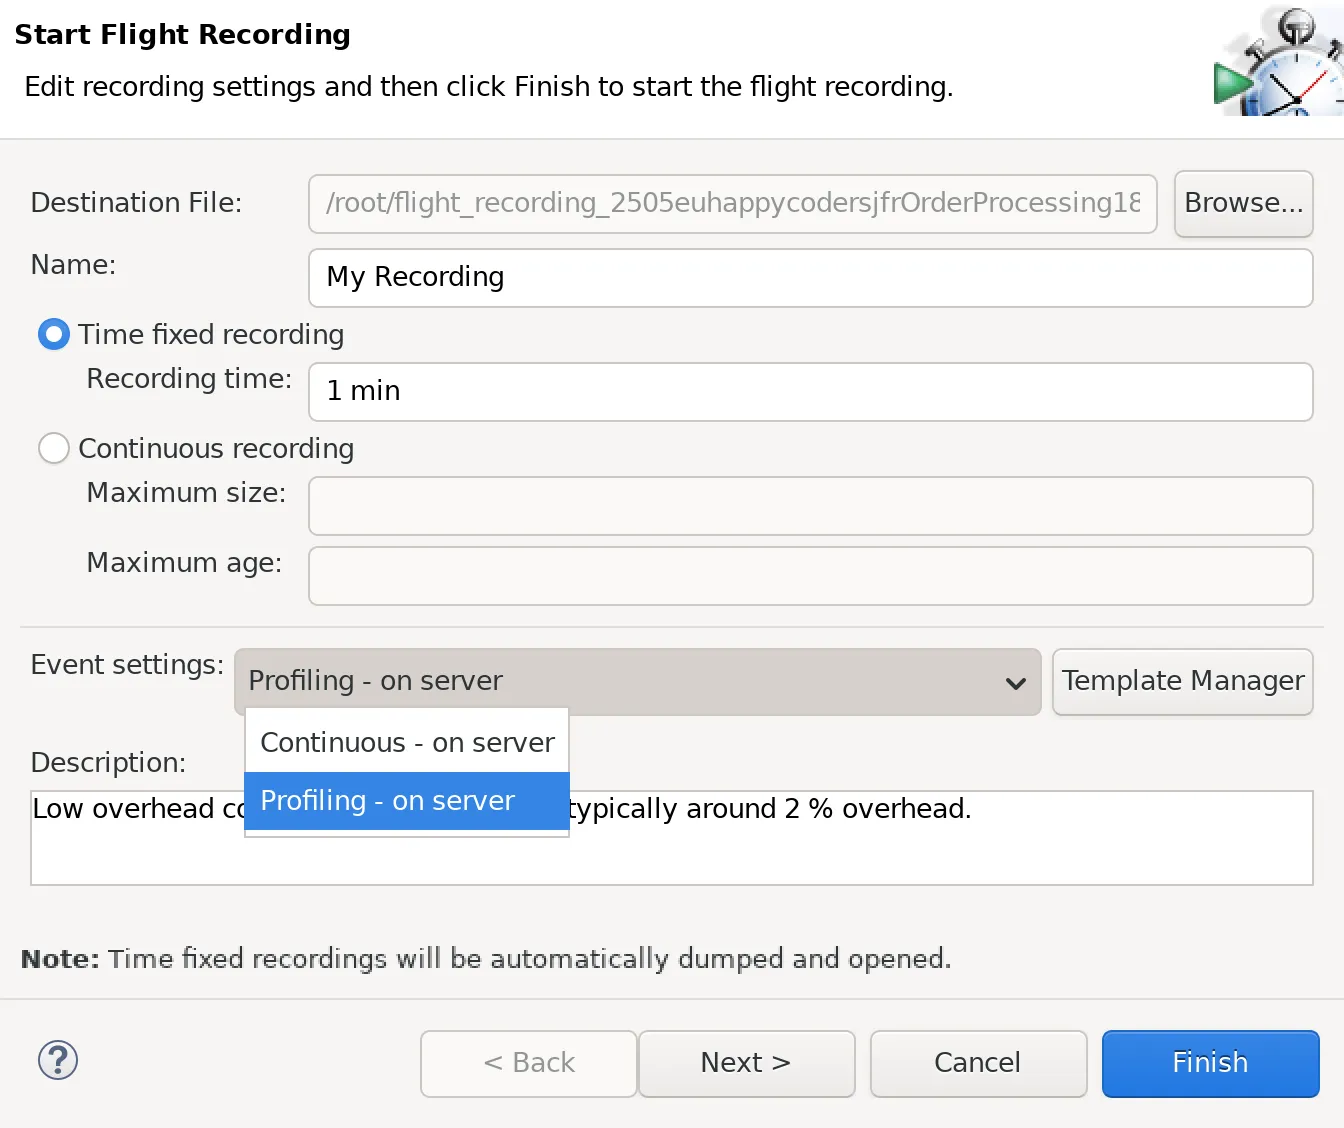
In the wizard, you specify the following settings:
- Destination File and Name: Where JMC writes the recording and under which name it runs in the JVM.
- Time fixed recording or Continuous recording: JMC automatically writes a fixed-duration recording to the file once the time is up and then opens it. A continuous recording keeps running until you stop it.
- Event settings: This is where you find the templates “Continuous - on server” and “Profiling - on server”. These are the JDK’s
defaultandprofilesettings under their display names.
You get the data of a continuous recording by right-clicking the recording in the JVM Browser: “Dump whole recording” writes the entire recording to a file, “Dump last part of recording” only the most recent time span.
The JMC User Interface
After opening JDK Mission Control, you see the following user interface:
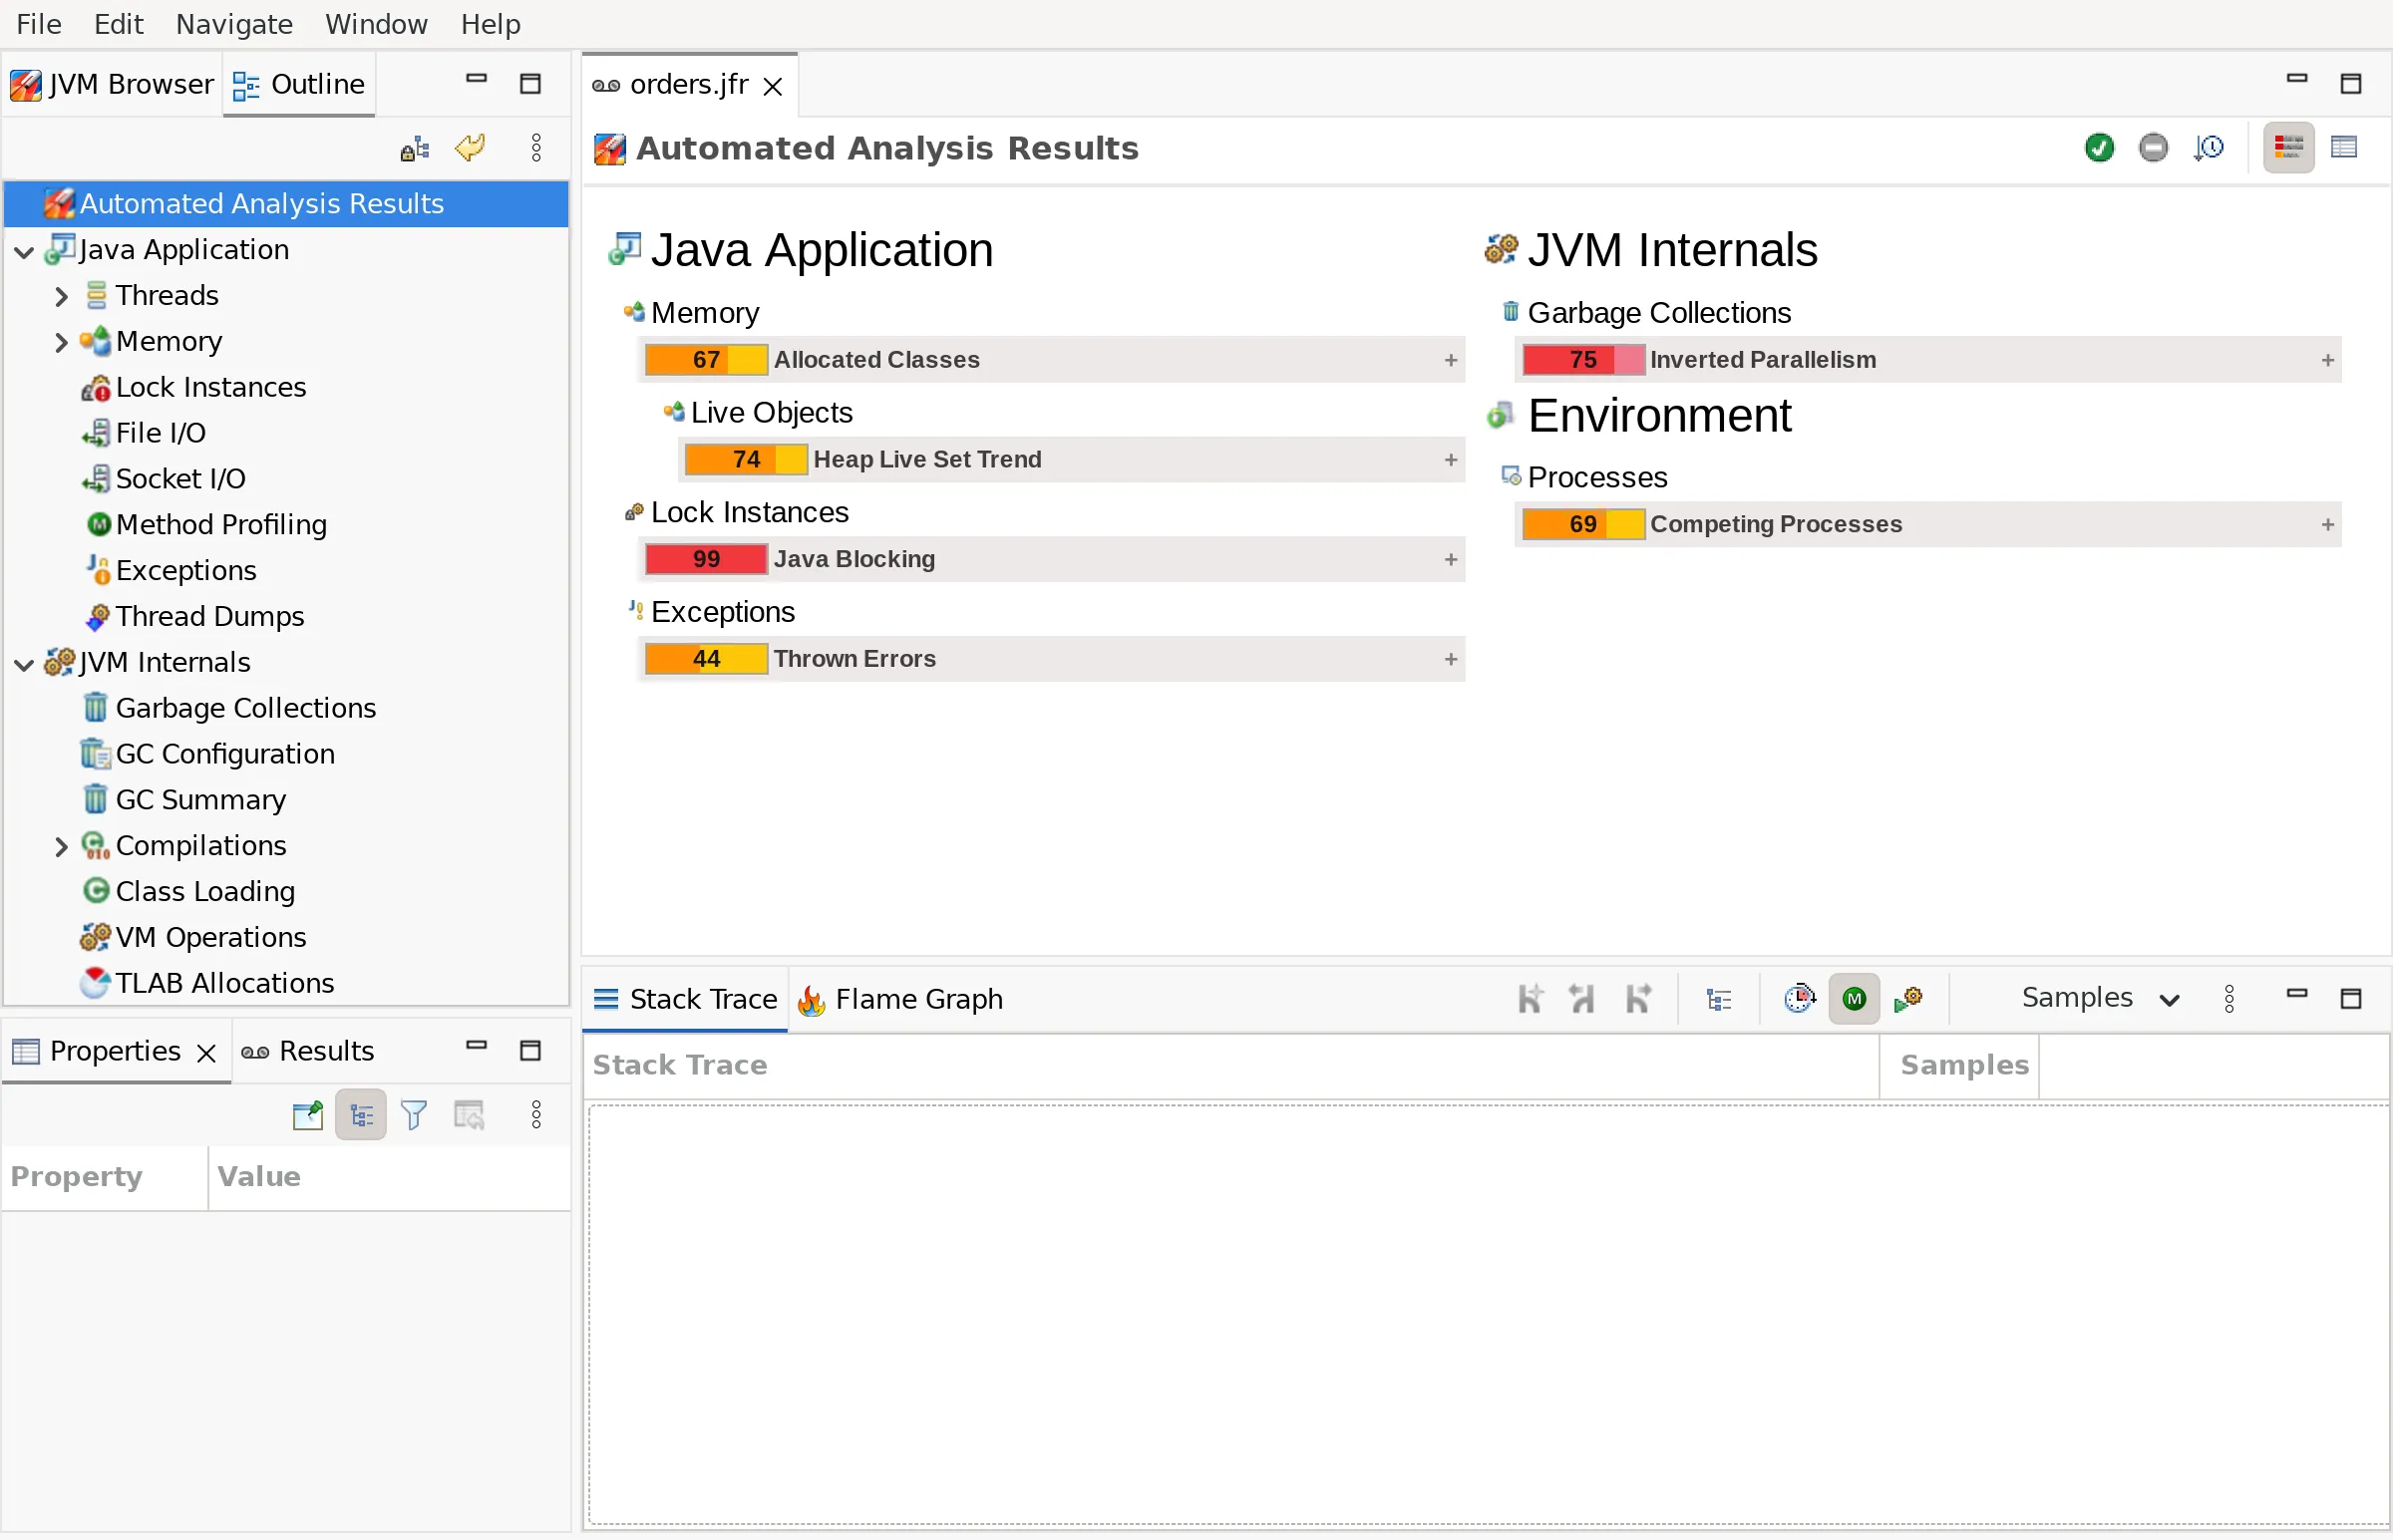
At the top left, next to the JVM Browser, is the Outline, a tree with the analysis pages of the recording:
- Automated Analysis Results: the results of the 68 rules with which JMC automatically checks the recording – more on this in the next section.
- Java Application: Threads, Memory with the subpage Live Objects, Lock Instances, File I/O, Socket I/O, Method Profiling, Exceptions, and Thread Dumps.
- JVM Internals: Garbage Collections, GC Configuration, GC Summary, Compilations, Class Loading, VM Operations, and TLAB Allocations.
- Environment: Processes, Environment Variables, System Properties, Native Libraries, Agents, and Recording.
- Event Browser: all events, sorted by event type.
The selected analysis page is shown in the main area at the top right. Below it, the Stack Trace view shows the stack traces of the events you have selected on the analysis page, merged into a tree with the columns “Samples” and “Percentage”. In the tab next to it, the Flame Graph shows the same stack traces as a graphic. We will cover both further below: the “Stack Trace” view on the “Memory”, “Lock Instances”, and “Exceptions” pages, the flame graph in the section The Flame Graph.
This interaction is the core of working with JMC: you select a row on an analysis page – e.g., a method, a class, a lock – and the views below it show you where the corresponding events come from.
Automated Analysis: What JMC Finds on Its Own
After opening a recording, the “Automated Analysis Results” page shows the results of the 68 rules with which JMC automatically checks every recording, grouped by analysis page. Each rule assigns a score from 0 to 100:
- 75 and above: a warning,
- 25 to 74: a notice,
- below 25: OK.
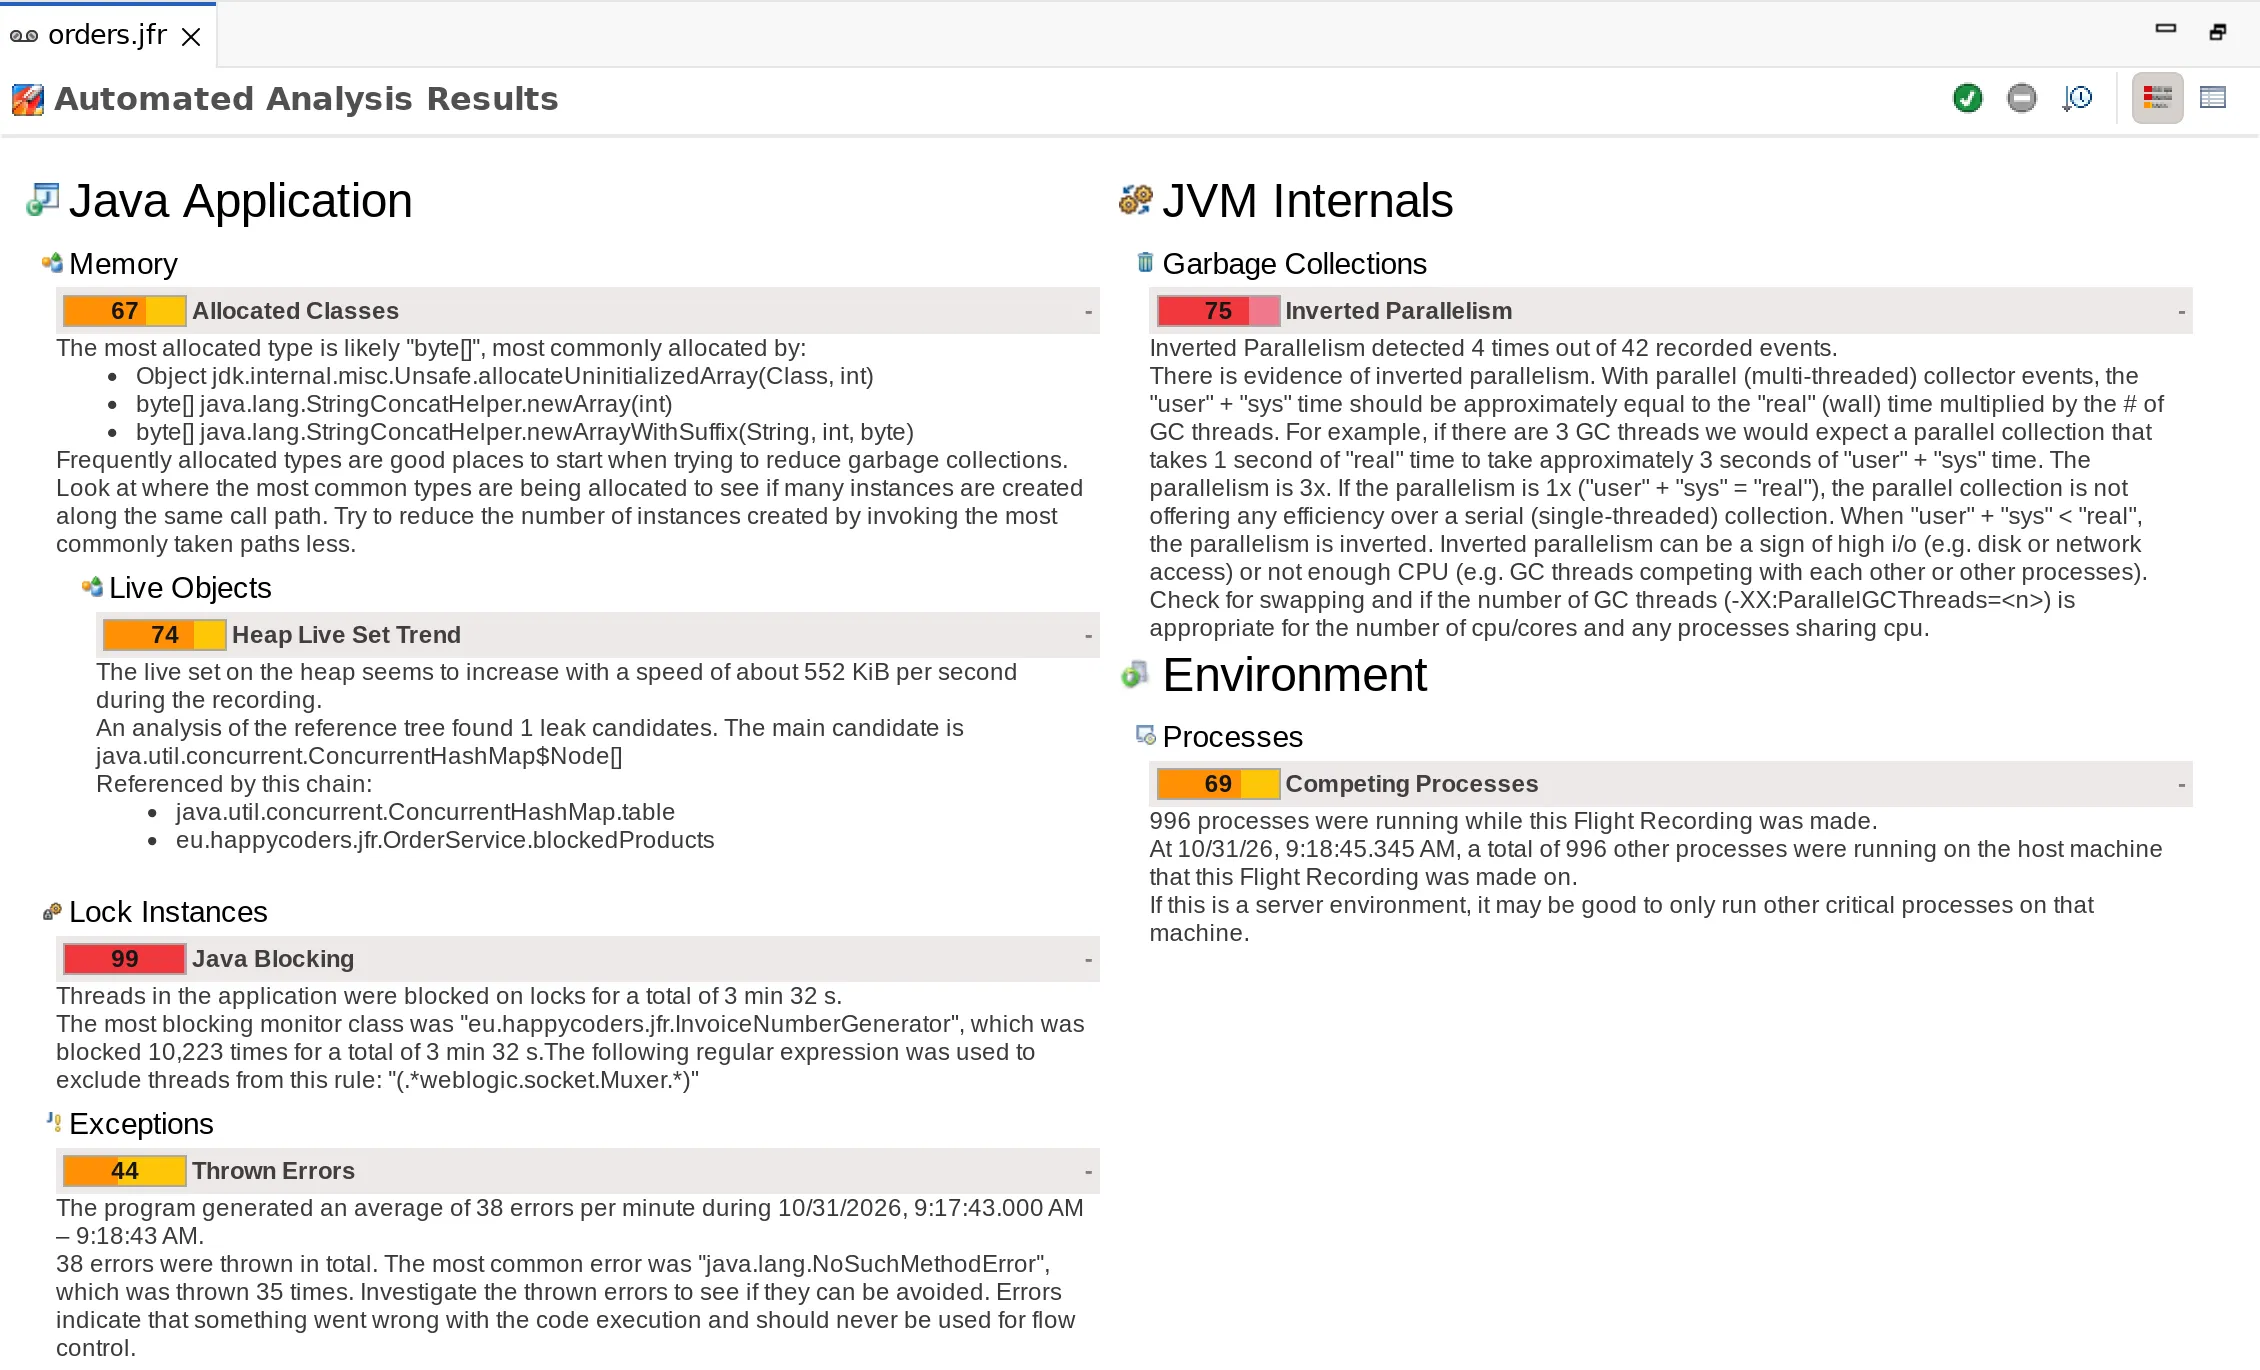
For the example’s recording, JMC reports two warnings and four notices:
| Rule | Score | Finding according to JMC |
|---|---|---|
| Java Blocking | 99 | Threads were blocked on locks for a total of 3 min 32 s, 10,223 times on InvoiceNumberGenerator. |
| Inverted Parallelism | 75 | In 4 of 42 garbage collections, the GC threads together used less CPU time than the collection took – so they waited more than they worked. |
| Heap Live Set Trend | 74 | The heap that remains occupied after the garbage collections grows by about 552 KiB per second; JMC names a memory leak candidate. |
| Competing Processes | 69 | 996 other processes were running on the machine. |
| Allocated Classes | 67 | byte[] is allocated the most, mostly via StringConcatHelper.newArray(). |
| Thrown Errors | 44 | 38 errors were thrown, 35 of them a NoSuchMethodError. |
So the Automated Analysis finds three of the five problems of the example on its own:
- The lock around the invoice number: “Java Blocking” names the class
InvoiceNumberGeneratorand the waiting time. - The cache without an upper bound: “Heap Live Set Trend” reports the growing so-called live set, i.e., the memory occupied by objects that are still reachable after a garbage collection.
- The string concatenation: “Allocated Classes” leads to the concatenation via
StringConcatHelper, but does not name the methodformatReceipt(), which ultimately causes the frequentStringConcatHelpercalls.
The analysis does not find two problems. The “Method Profiling” rule reports with a score of 7 that it found no method whose optimization would be particularly worthwhile – even though the threads spend a good half of their computing time in a linear search. And the “Thrown Exceptions” rule rates 31.9 exceptions per second with a score of 0.
The remaining three findings do not concern the program:
- Inverted Parallelism and Competing Processes: Both describe the machine. I recorded on my workstation, on which almost a thousand processes were running at the same time. As possible causes of “Inverted Parallelism”, the rule names a lot of I/O or too little CPU for the GC threads – with so many processes, the latter is the more likely one.
- Thrown Errors: The
NoSuchMethodErrors are thrown by the JDK itself, in thejava.lang.invokepackage when resolving method handles, not by the example’s code.
The Automated Analysis is therefore a good starting point, but no substitute for looking at the individual analysis pages. The following sections go through the five problems there one by one.
Method Profiling: Where Does the Application Spend CPU Time?
The “Method Profiling” page under “Java Application” evaluates the execution samples, the events of type jdk.ExecutionSample. The table in the upper half of the following screenshot lists the methods that were at the top of the stack at the time of a sample, with the number of samples (“Count”) and their share (“Percentage”).
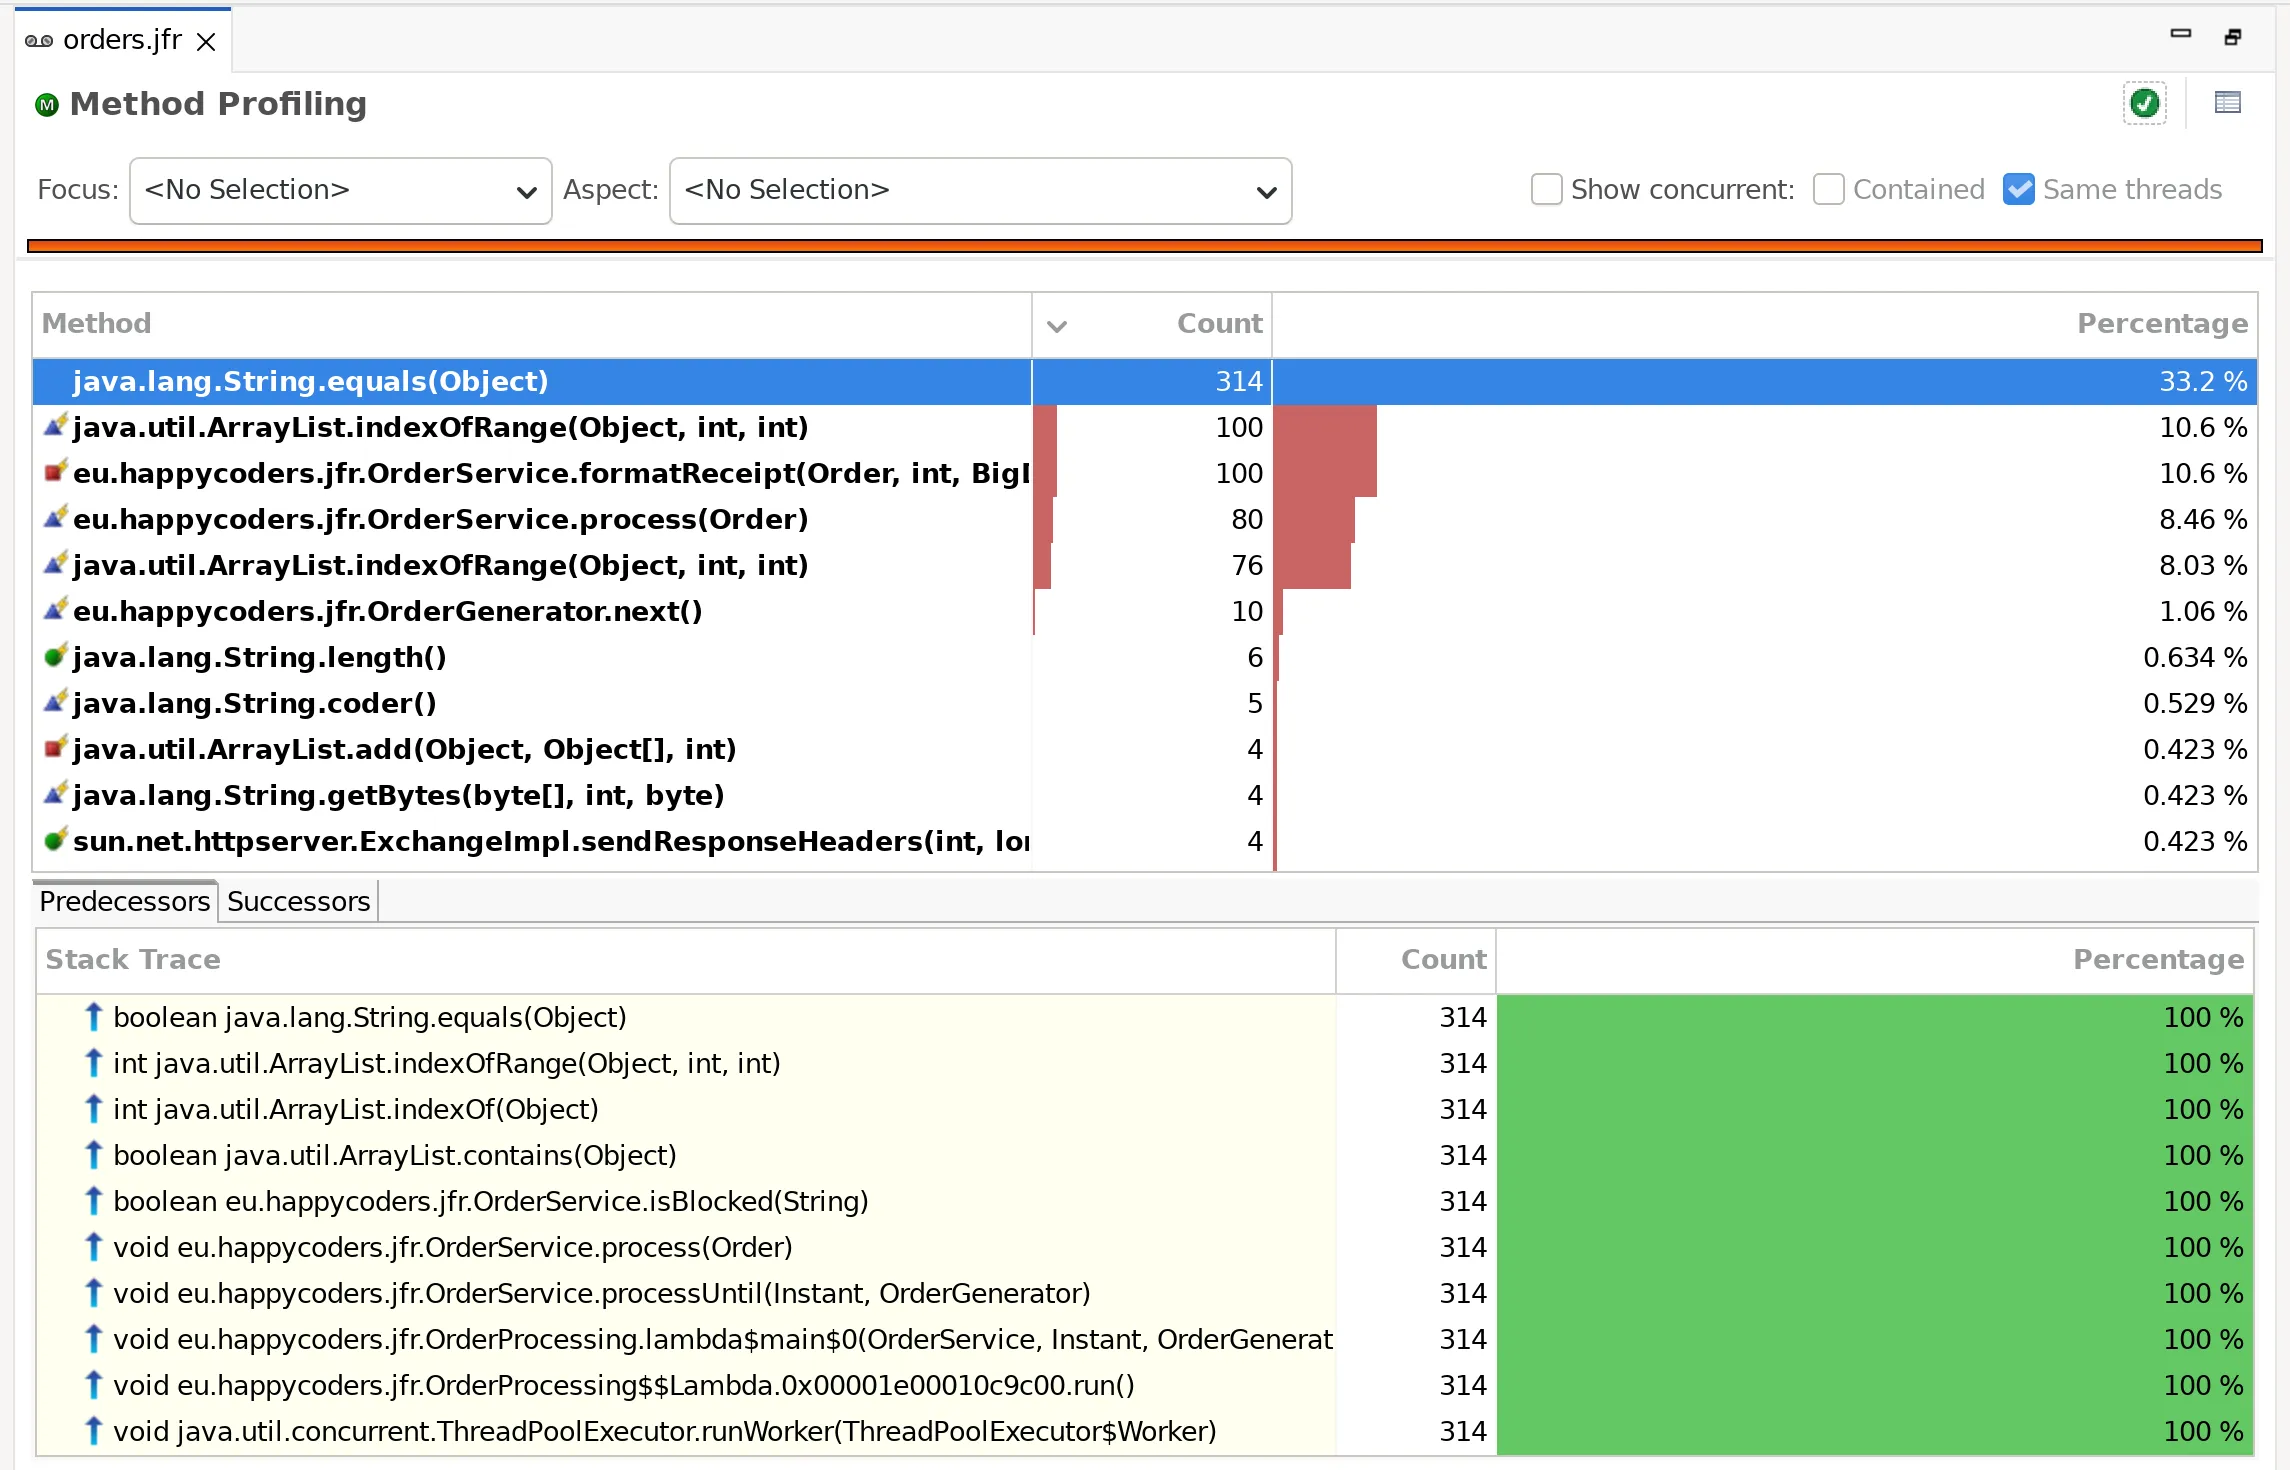
At the top is String.equals() with 314 of 946 samples (33.2%). ArrayList.indexOfRange() appears twice in the table, with 100 and with 76 samples: JMC separates a method by the type of its frame. A row’s tooltip shows which type it refers to: there, the method is followed by “[INLINED]” for the 100 samples and by “[JIT_COMPILED]” for the 76.
The icon in front of the name shows the method’s visibility by shape and color:
- green circle:
public, - blue triangle: package-private,
- red square:
private, - yellow diamond:
protected.
A small yellow lightning bolt at the top right of the icon marks frames that ran compiled or inlined rather than interpreted.
A JDK method at the top does not yet tell you which code of the example calls it. The “Predecessors” tab below the table shows this: for the selected method String.equals(), it expands the callers level by level:
java.lang.String.equals(Object)
  java.util.ArrayList.indexOfRange(Object, int, int)
    java.util.ArrayList.indexOf(Object)
      java.util.ArrayList.contains(Object)
        eu.happycoders.jfr.OrderService.isBlocked(String)
          eu.happycoders.jfr.OrderService.process(Order)
If you select several methods, each of them appears as a separate node at the top level of the tree. If a method is called from different places, the tree branches: its node then contains all callers, each with its number of samples, sorted in descending order. In the following screenshot, all methods of the table are selected, and String.length() is expanded: in its 6 samples, it was called by four different methods – three times by StringConcatHelper.stringSize() and once each by three other methods:
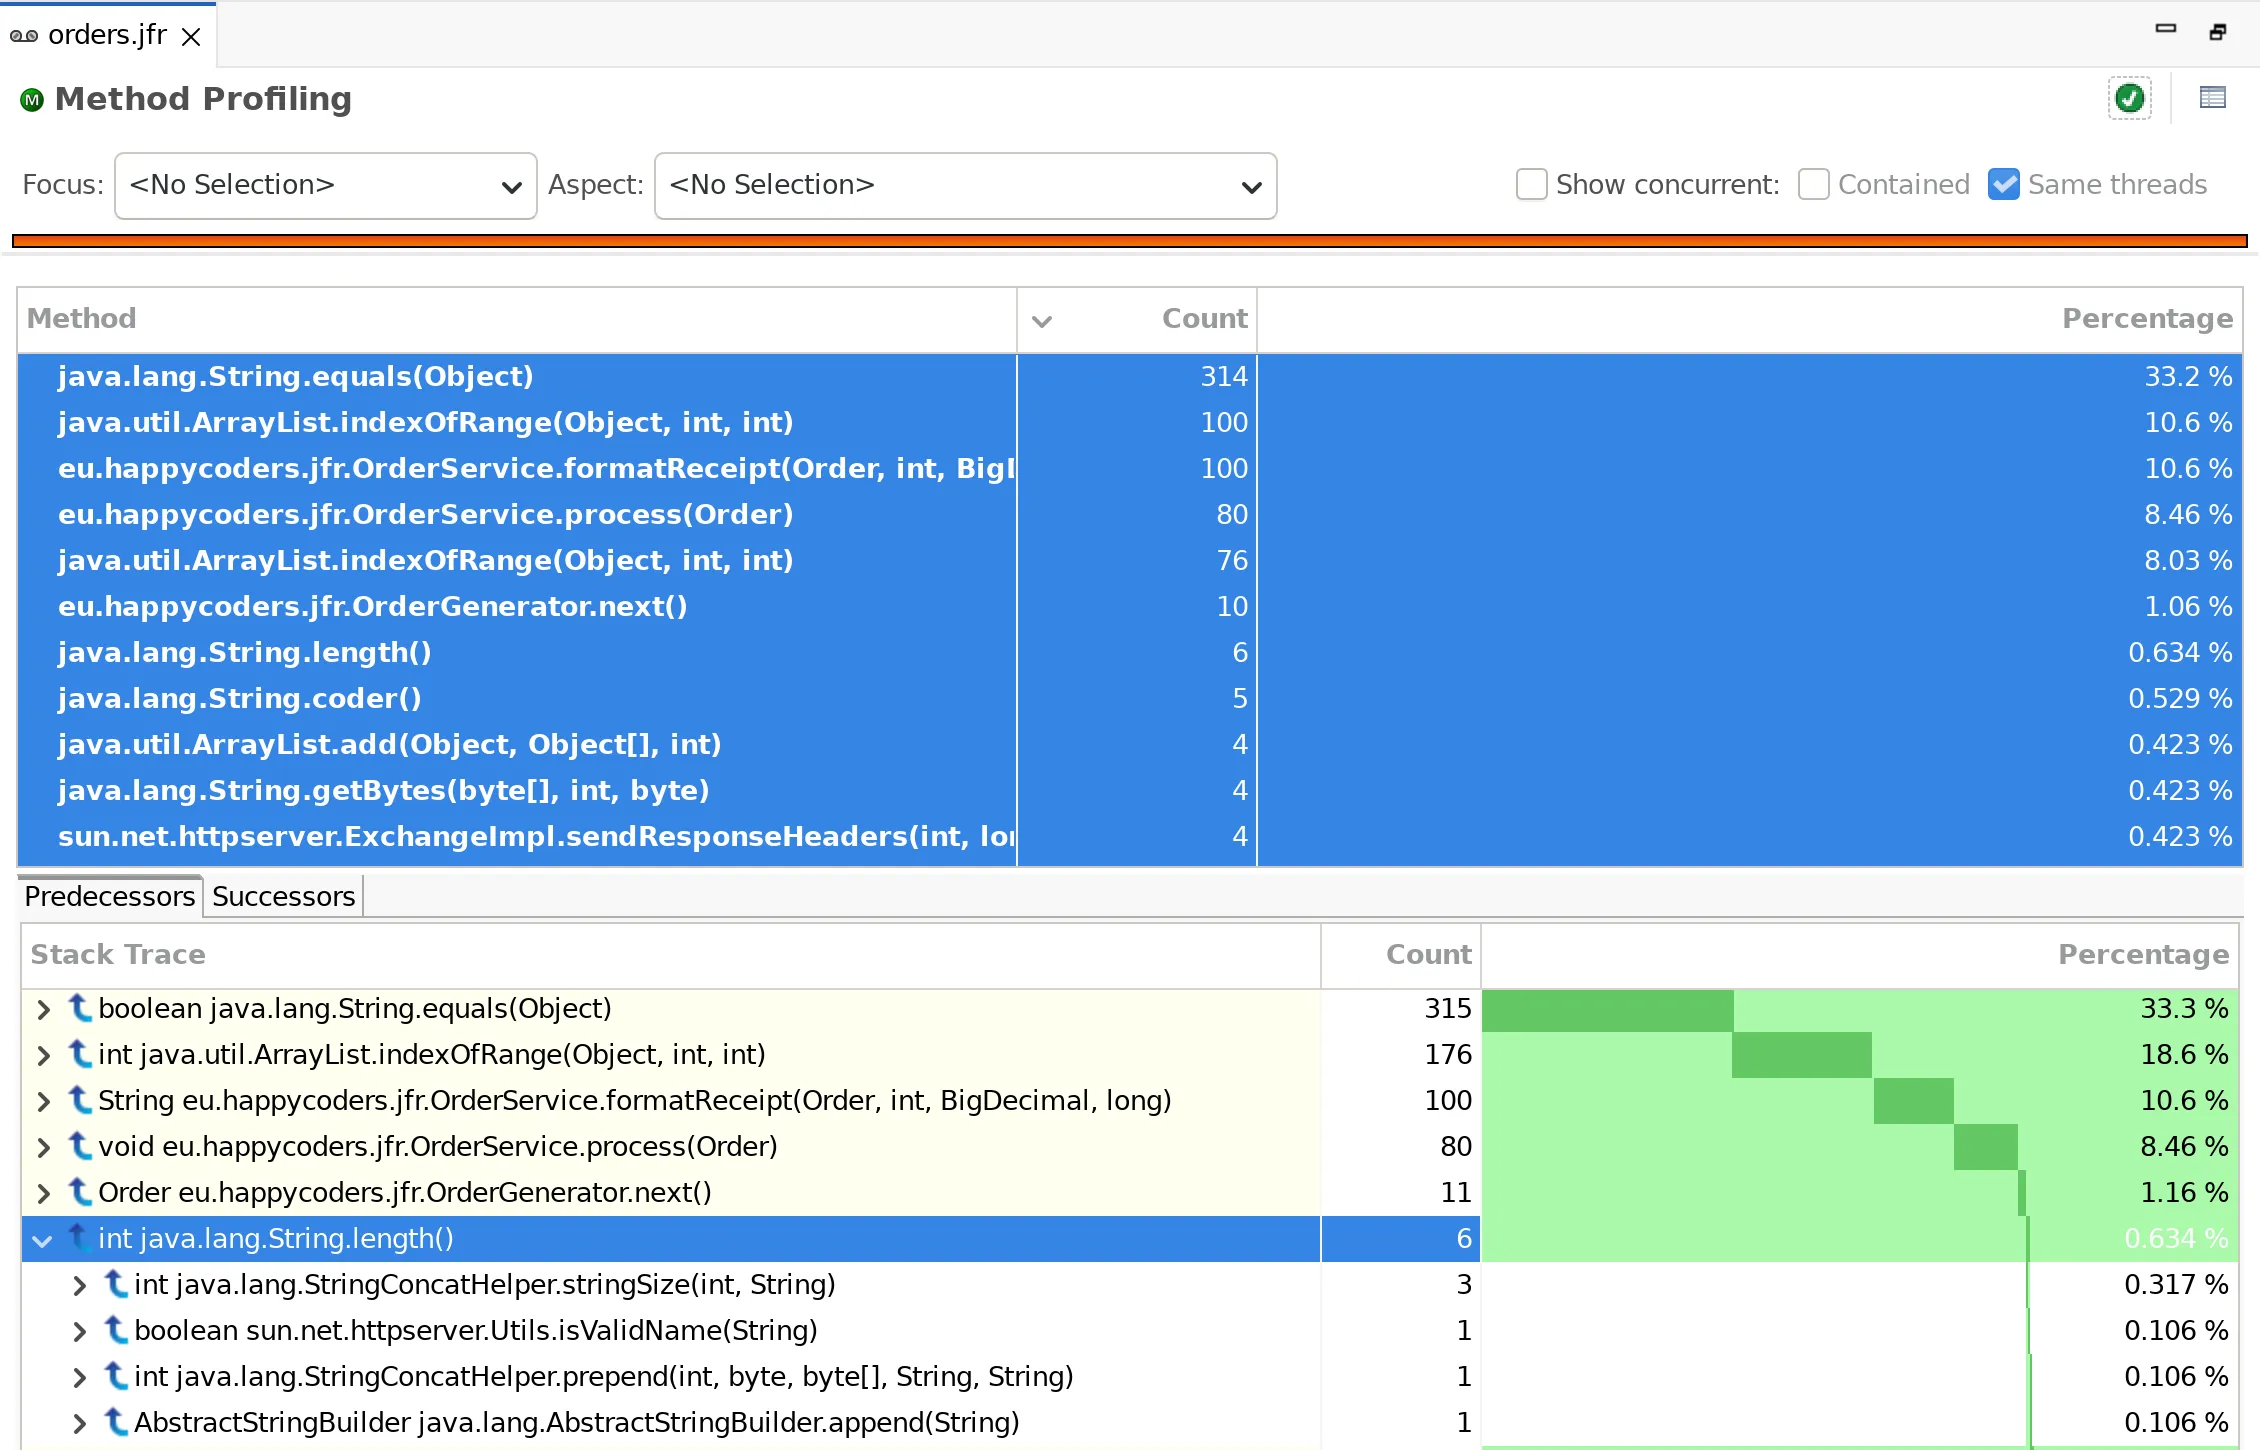
“Predecessors” merges the samples of a method across all frame types: 315 samples (33.3%) for String.equals() and 176 (18.6%) for indexOfRange(). Only after that, with formatReceipt() and 100 samples, comes a method from the example.
Conversely, the “Successors” tab next to it shows which methods are called by the selected method, also as a branching tree. However, it always evaluates only one method, even if you select several rows. And in JMC 9.1.2, the number in its top row is twice as high as the number of samples due to a bug: for process(), it shows 1,532, although process() occurs in only 766 samples. The numbers in the rows below are correct.
The Flame Graph
The flame graph in the tab next to “Stack Trace” shows all stack traces of the samples at once. Each bar is a method; the bars above it are the methods called by that method. The width of a bar corresponds to the share of samples in whose stack trace the method occurs at this position.
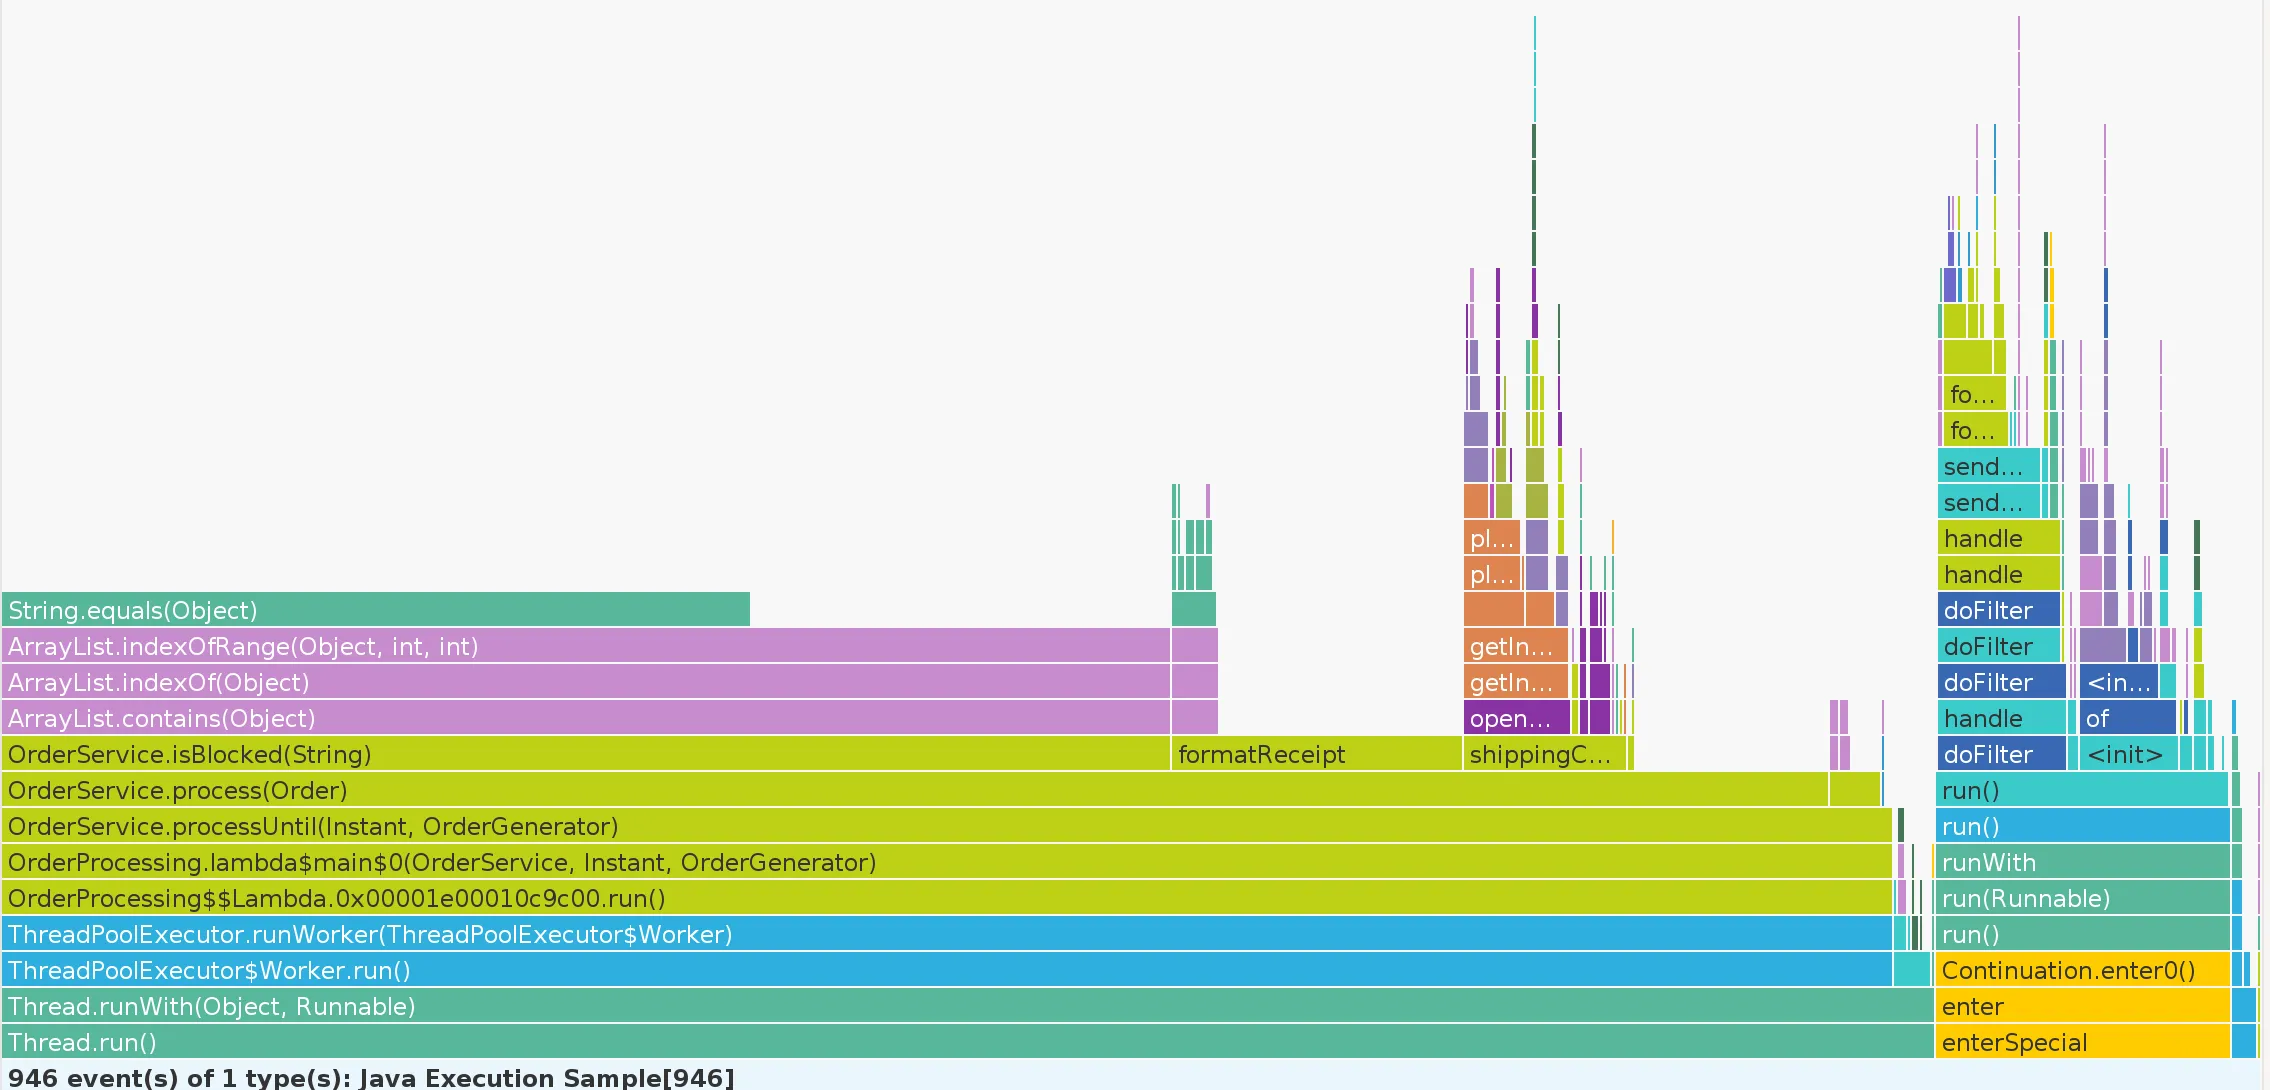
Above OrderService.process() is a tower that is wider than all the others: OrderService.isBlocked(), above it ArrayList.contains(), indexOf(), indexOfRange(), and at the very top String.equals(). The bar of isBlocked() covers 490 of the 946 samples, i.e., 51.8%: that is how often isBlocked() was in the stack trace. So more than half of the computing time goes into checking against the block list.
The cause is in the code: blockedProducts is an ArrayList with 200,000 product numbers, and contains() compares the number it is looking for with each of them in turn. A HashSet, on the other hand, would find an element via its hash value, with a single comparison in the normal case.
The difference between the table and the flame graph: the table only counts the top method of each sample. In the 490 samples with isBlocked(), that was a JDK method every time, String.equals() 314 times and indexOfRange() 176 times – which is why isBlocked() does not appear in the table of the “Method Profiling” page at all. The flame graph shows the entire stack trace and thus which code of the example calls the expensive JDK methods.
For large graphs, the view’s search field helps: it highlights all bars of a method. You can also switch the view from “Flame Graph” to “Icicle Graph”, in which the graph grows from top to bottom, and you can save the graph as a PNG or JPEG image.
Memory: Which Code Creates the Most Objects?
The “Memory” page lists the allocated classes in a table at the top, among others with the column “Total Allocation (%)”, the estimated share of the class in all allocations. Below the table, it shows the allocations and the heap over time as a graph.
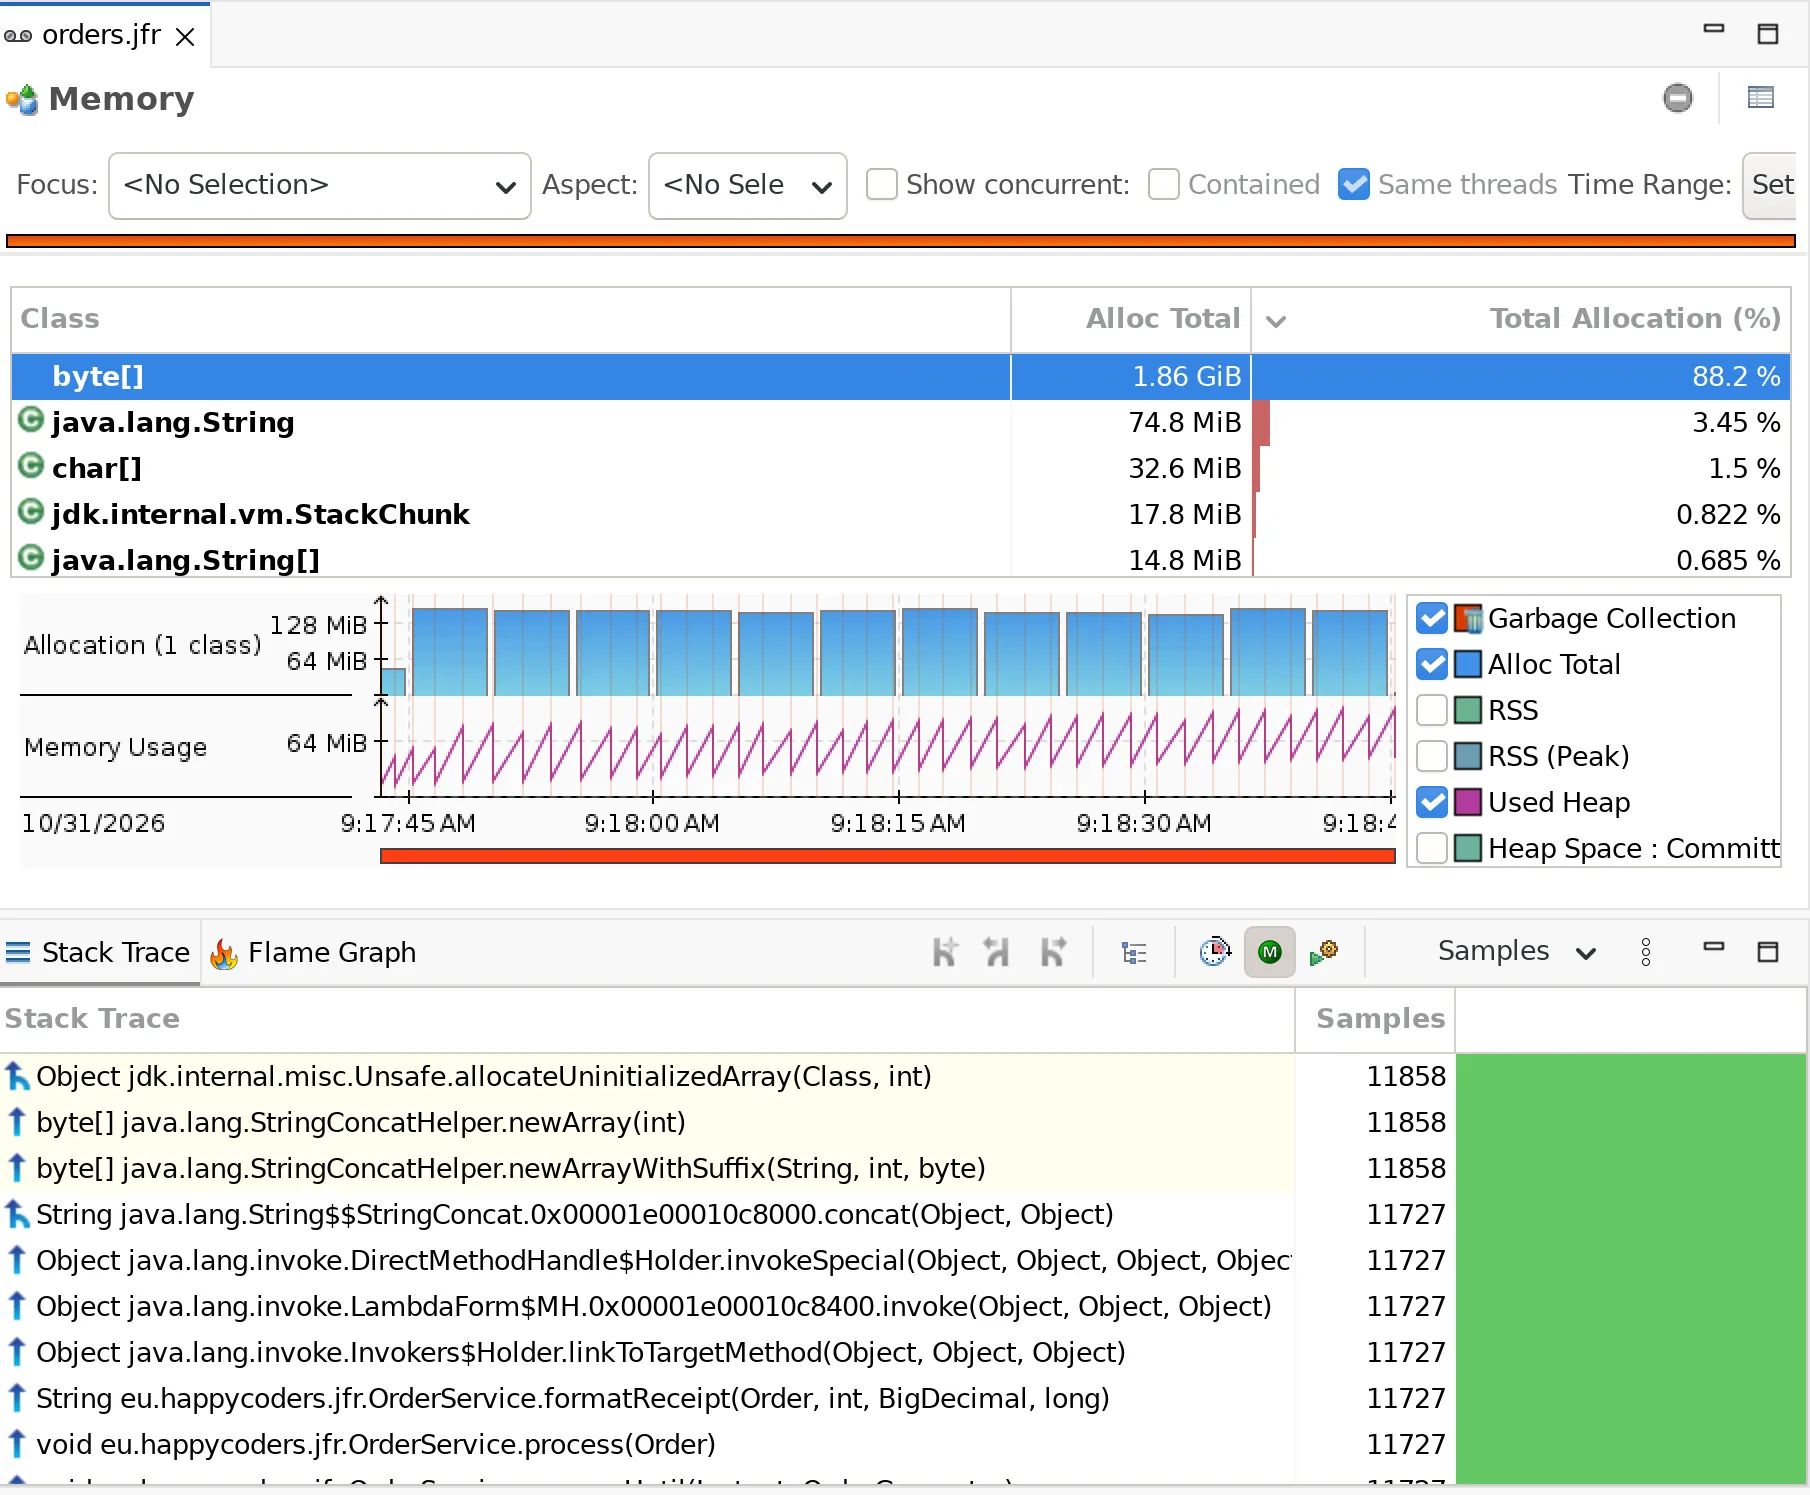
byte[] is at the top with 88.2%. A byte array is the content of almost every string, so the class alone does not say much. The “Stack Trace” view shows the code behind the allocation of byte arrays as soon as you select byte[] in the table. The path it shows begins like this:
jdk.internal.misc.Unsafe.allocateUninitializedArray(Class, int)
java.lang.StringConcatHelper.newArray(int)
java.lang.StringConcatHelper.newArrayWithSuffix(String, int, byte)
Below that follow four frames with which the JVM executes the + operator for strings – a generated class String$$StringConcat and three frames from java.lang.invoke – and then OrderService.formatReceipt(). So the byte arrays are created during the string concatenation in formatReceipt().
The view always shows only one path. Where the stack traces branch, it follows the branch with the most samples, here the most allocation events – not the branch with the most bytes. You can recognize the branches by the icons and colors: a simple arrow precedes a frame at which all samples of the branch take the same path. An arrow with a fork marks the first frame of a branch that has other branches next to it – in the screenshot above at allocateUninitializedArray() and at String$$StringConcat.concat(). The background color alternates between yellow and white with each new branch. You switch to the other branches with the left and right arrow keys or with “Previous Frame Group” and “Next Frame Group” in the view’s toolbar.
Across all classes, 80.3% of the allocated bytes come from formatReceipt() – 1.82 of a total of 2.27 GB in 62 seconds. The “Stack Trace” view shows these numbers if you change three settings: in the table, you select all classes; in the view’s context menu, you set “Group Stacktraces From” to “Thread Root”; and in the selection box at the top right, you choose “Sample Weight” instead of “Samples”. Then each path starts at the thread, and the “Sample Weight” column sums up the estimated bytes. In the row with OrderService.formatReceipt(), you then see the 1.82 GB and the 80.3%:
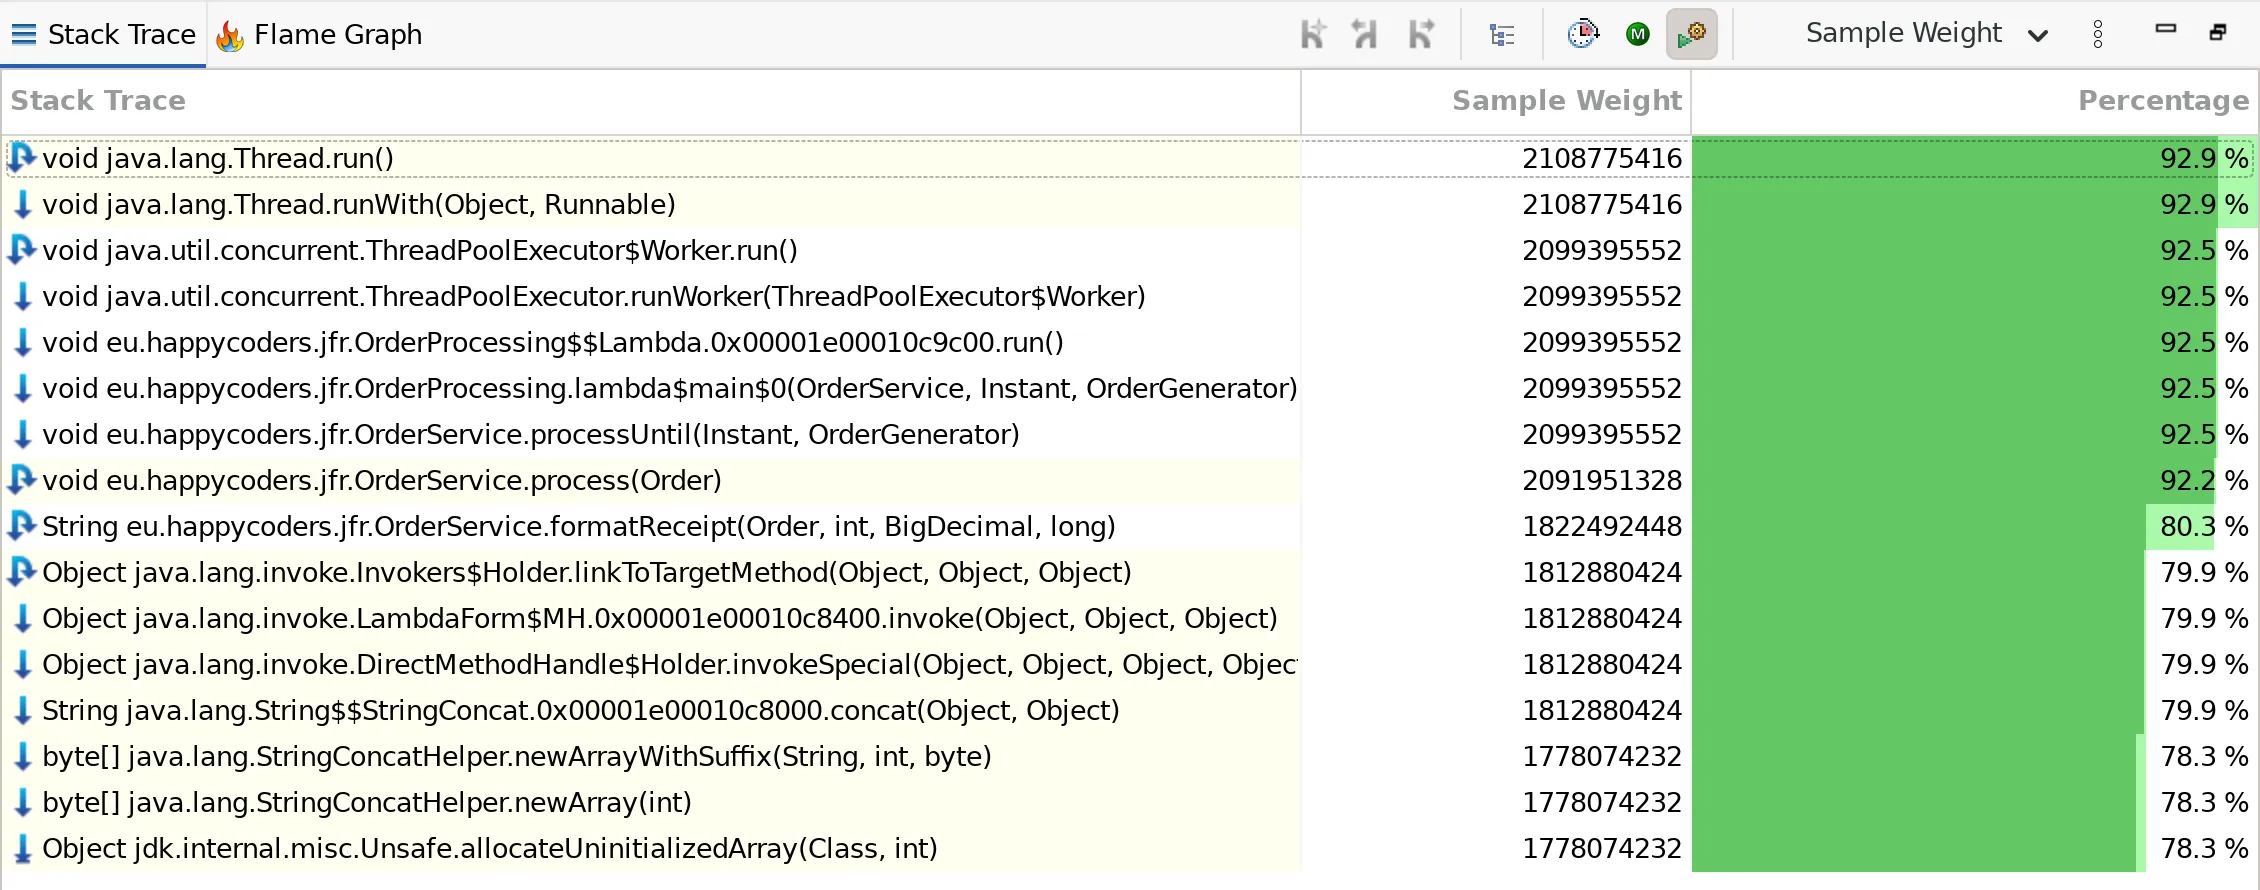
The cause: formatReceipt() appends each order item to the previous receipt text with +=. Each concatenation creates a new string and copies the entire previous text in the process. With 50 to 149 items per order, the amount copied grows quadratically with the number of items. A StringBuilder, on the other hand, would assemble the text in a single pass.
Live Objects: What Is Holding On to Memory?
The heap history on the “Memory” page (in the screenshot of the previous section) shows a sawtooth pattern: the heap grows until a garbage collection removes the objects that are no longer reachable. Take a look at the low points of the sawtooth, i.e., the heap directly after each garbage collection: they rise over the runtime – from 15.8 MB after the fourth garbage collection shortly after the start to 47.5 MB after the last one, the 42nd collection. This rise is the live set that the “Heap Live Set Trend” rule also reported.
The “Live Objects” subpage of “Memory” shows which objects are being held on to. It evaluates the events of type jdk.OldObjectSample: samples of objects that stay alive for a long time, with the path from the GC root to the object. The example’s recording contains 188 such samples.
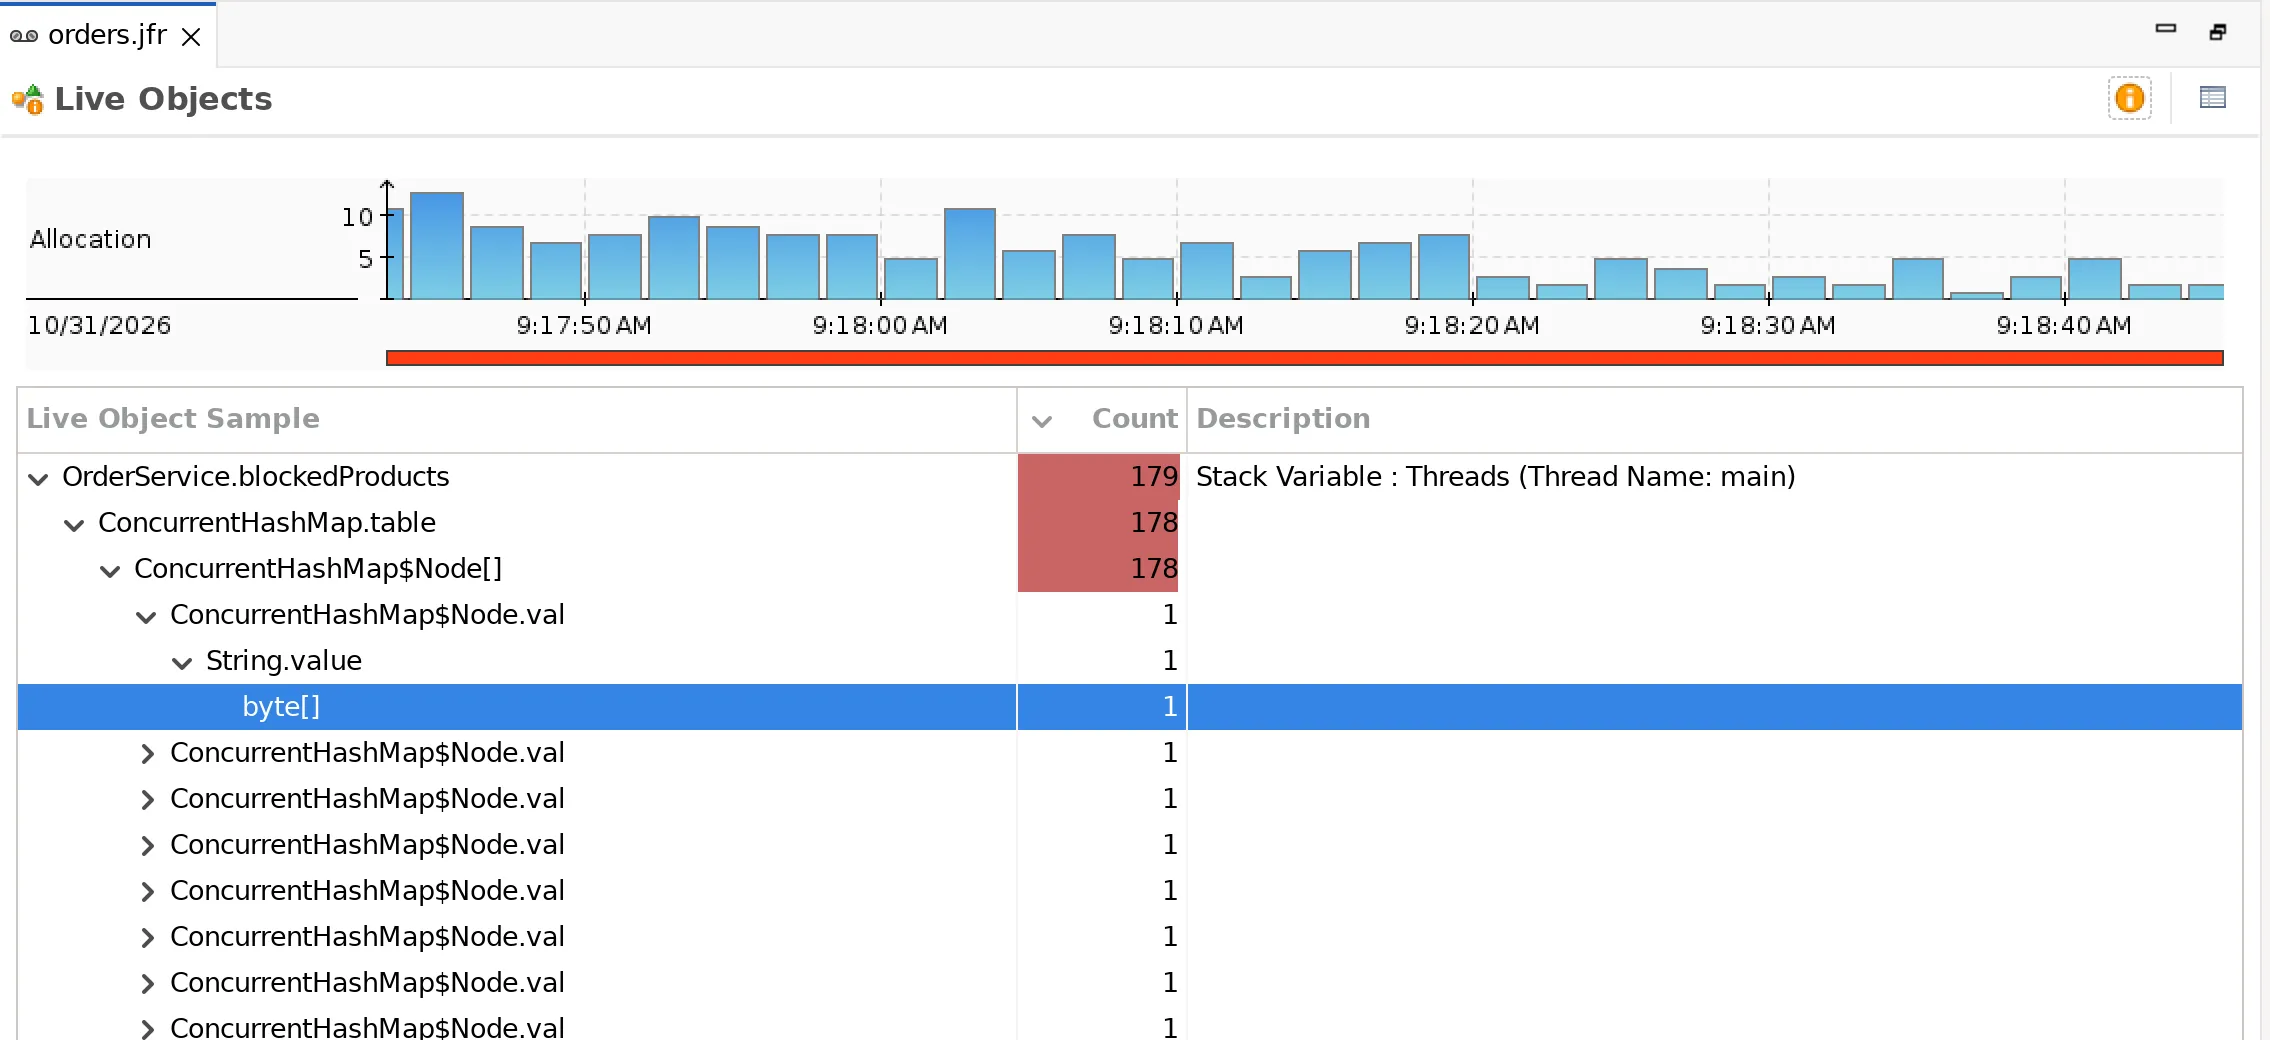
The table merges the paths of all samples into a tree. The “Count” column states how many samples lie below a node. For the top-level nodes, the “Description” column describes the GC root, here a local variable of the main thread. JMC estimates how likely a node is to hold on to a memory leak as “Relevance”. The value is in a hidden column that you can display via “Visible Columns” in the context menu. However, the relevance doesn’t help much in the example: the highest value, 2.99, goes to the ArrayList of the block list with a single sample, while the ConcurrentHashMap of the cache gets only 0.95.
At first, the tree only shows the classes of the objects on the path. You can show the names of the fields through which one object references the next via the context menu, with “Object Formatting Options > Field”. Of the 188 samples, 178 lead through the same chain:
- The
OrderServiceobject references aConcurrentHashMapvia its fieldreceiptCache, - the
ConcurrentHashMapreferences an array ofConcurrentHashMap$Nodeobjects via its fieldtable, - the nodes reference the strings of the receipt texts,
- and finally, the strings reference their byte arrays.
This is the cache without an upper bound: the program stores every receipt in it and never removes one. A cache with an upper bound or with an expiration time for its entries would fix this.
Lock Instances and Socket I/O: What Are the Threads Waiting For?
The “Method Profiling” page only shows where the threads compute. However, the worker threads in the example spend most of their time waiting – for a lock or for the network.
Lock Instances
The “Lock Instances” page lists the classes of the objects on whose monitor threads were blocked, with the columns “Total Blocked Time”, “Distinct Threads”, and “Count”. You can show the columns “Maximum Blocked Time” and “Average Blocked Time” via “Visible Columns” in the context menu. In the example, there is only a single class:
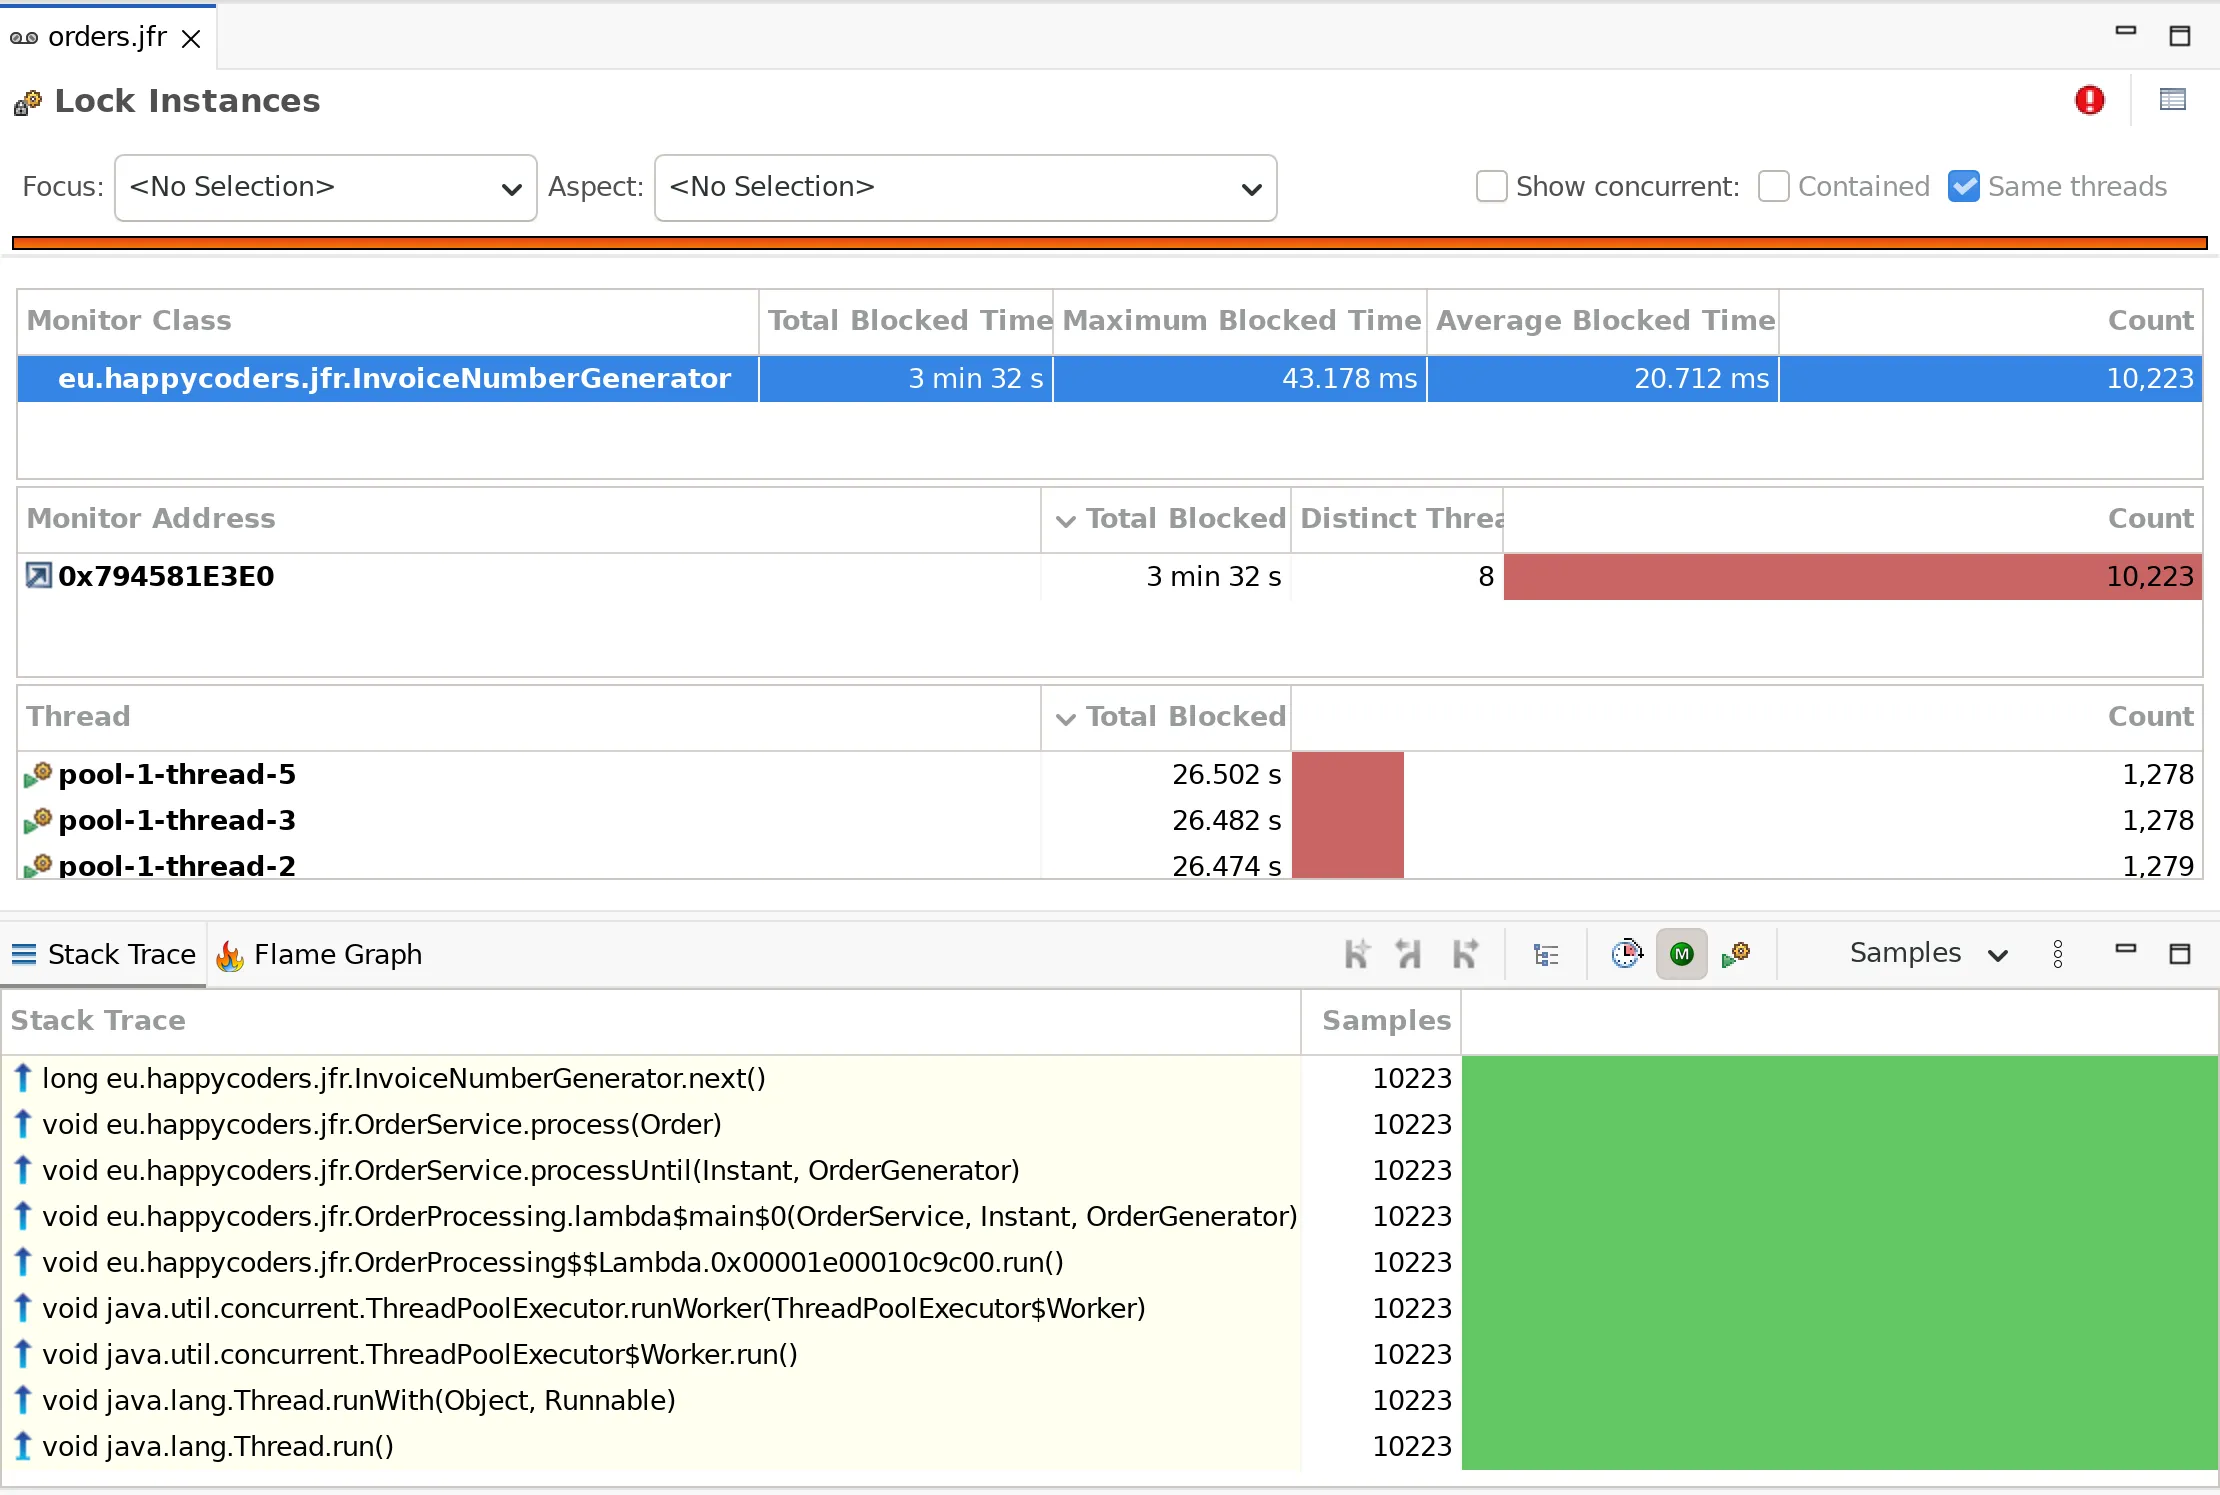
The threads were blocked on InvoiceNumberGenerator 10,223 times, for a total of 3 min 32 s, on average for 20.7 ms and at most for 43.2 ms. All eight worker threads wait there, each about 1,278 times. The “Stack Trace” view leads to the method InvoiceNumberGenerator.next(), called from OrderService.process().
The next() method is synchronized and simulates a 5 ms database access inside it. So the generator cannot issue more than 200 invoice numbers per second, and the eight threads queue up. A sequence in the database or a generator that reserves numbers in blocks would remove this bottleneck. The calculation for this is in the section What Are the Threads Waiting For? of the JFR article.
Socket I/O
The “Socket I/O” page shows the second waiting time. It groups the read and write operations by host, by port, or by both. In the example, all 10,238 read operations go to 127.0.0.1, i.e., localhost, where the simulated shipping service runs. They take 20.7 ms on average and at most 54.4 ms, for a total of 3 min 32 s. The average and maximum are in the columns “Average I/O Time” and “Maximum I/O Time”, which you display via “Visible Columns”, as with “Lock Instances”.
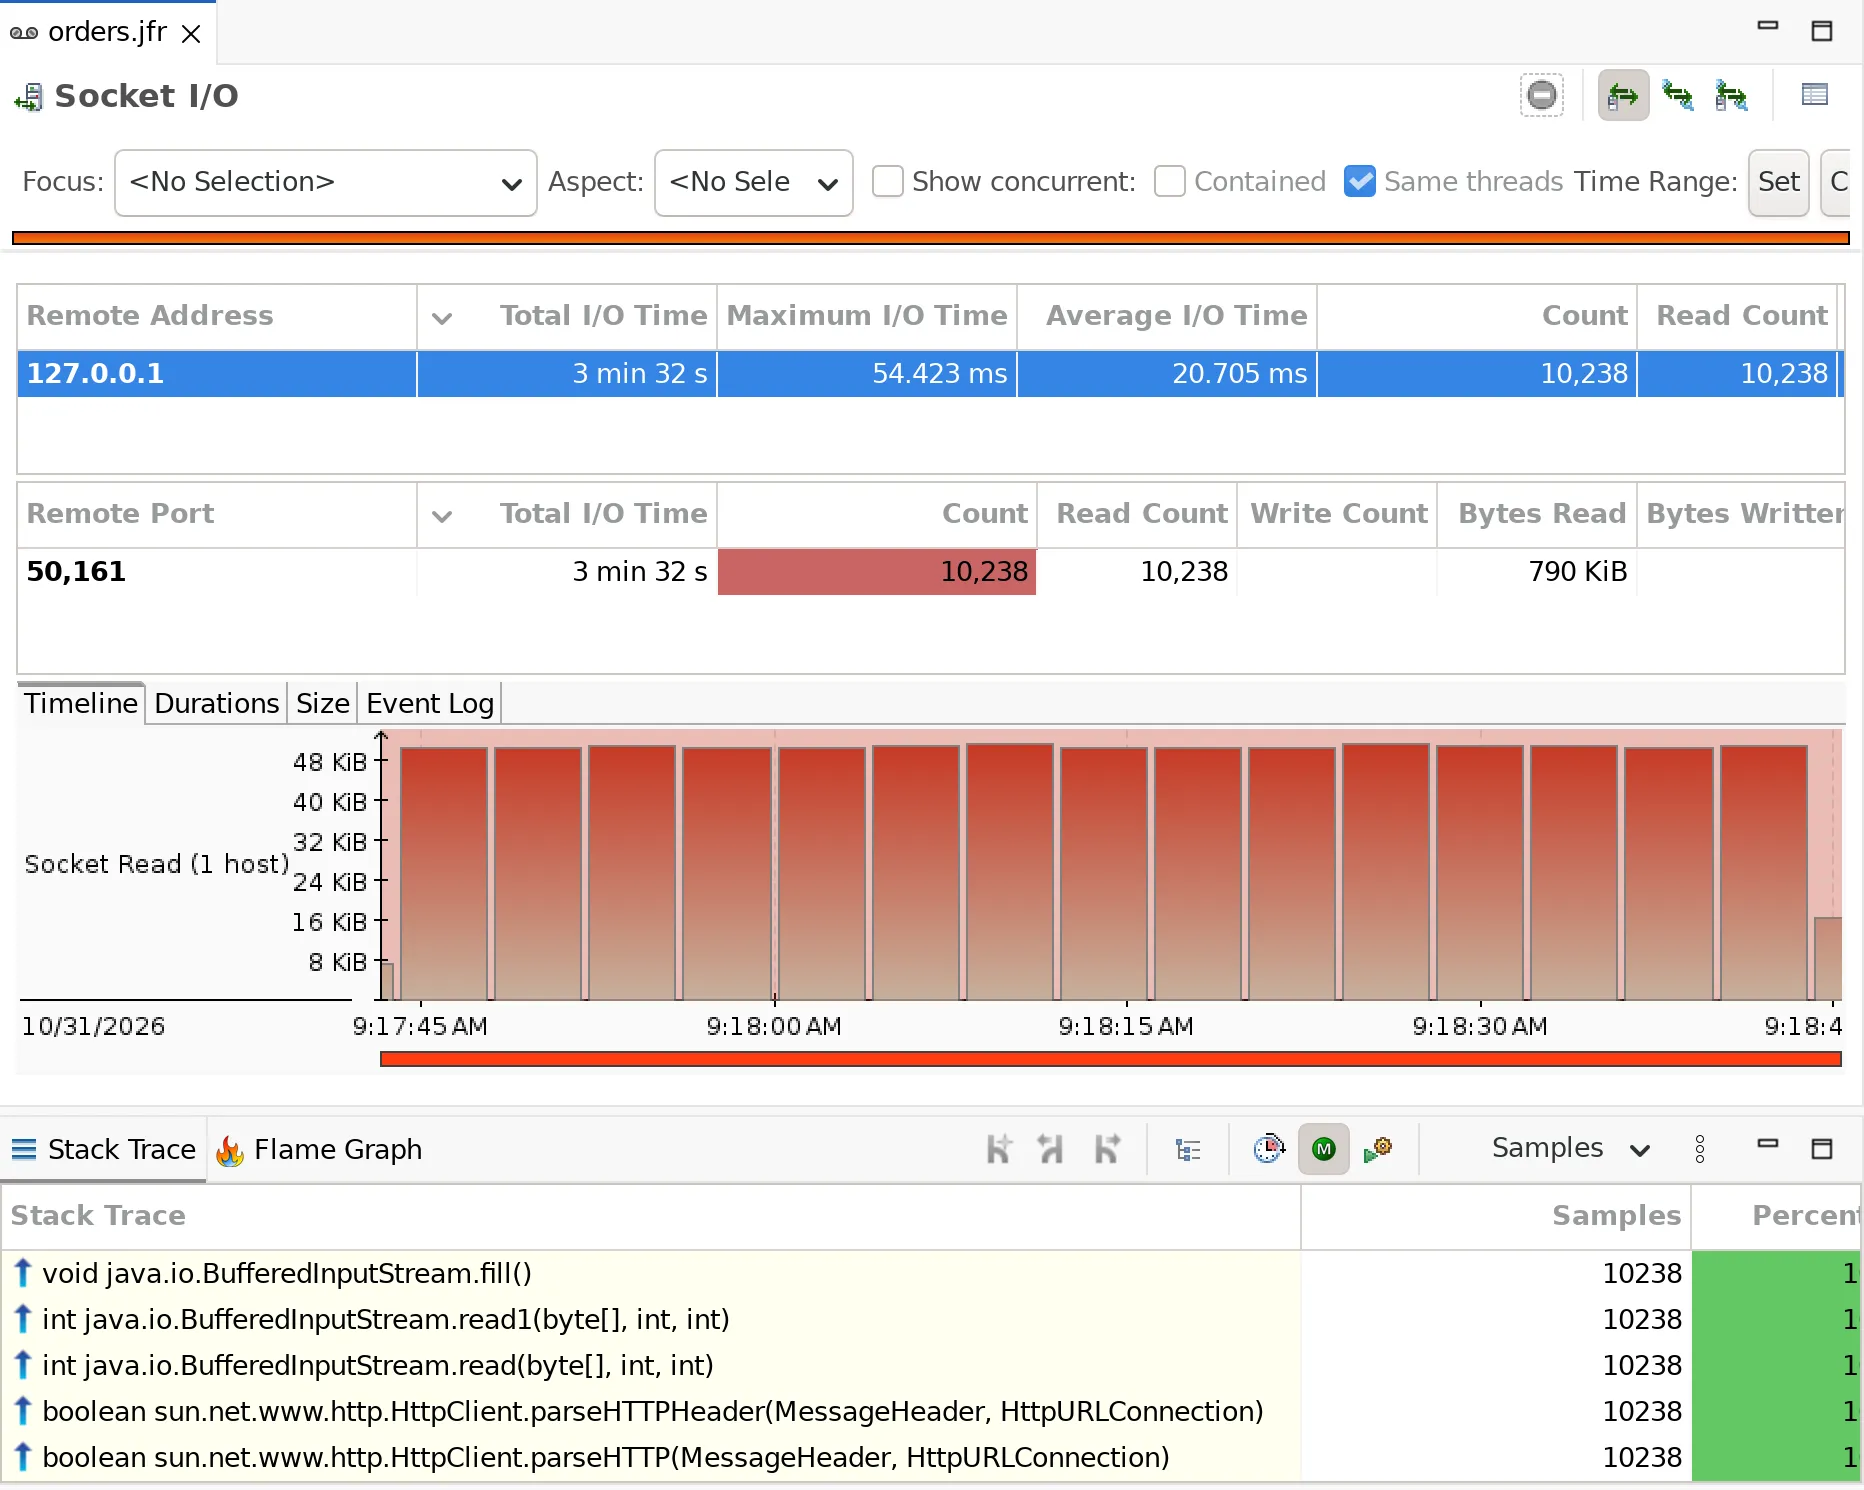
The 20 ms are the response time of the shipping service; they cannot be sped up on the caller’s side. The waiting time would disappear with a cache for the shipping costs.
The Thread Timeline
The “Threads” page shows what an individual thread was waiting for and when. It draws a timeline for each thread, showing the thread’s events as colored bars.
To see the rhythm of the worker threads, show the thread table with the table icon at the top right, select the eight worker threads in it, and narrow the time range to 400 ms under “Filter Events”:
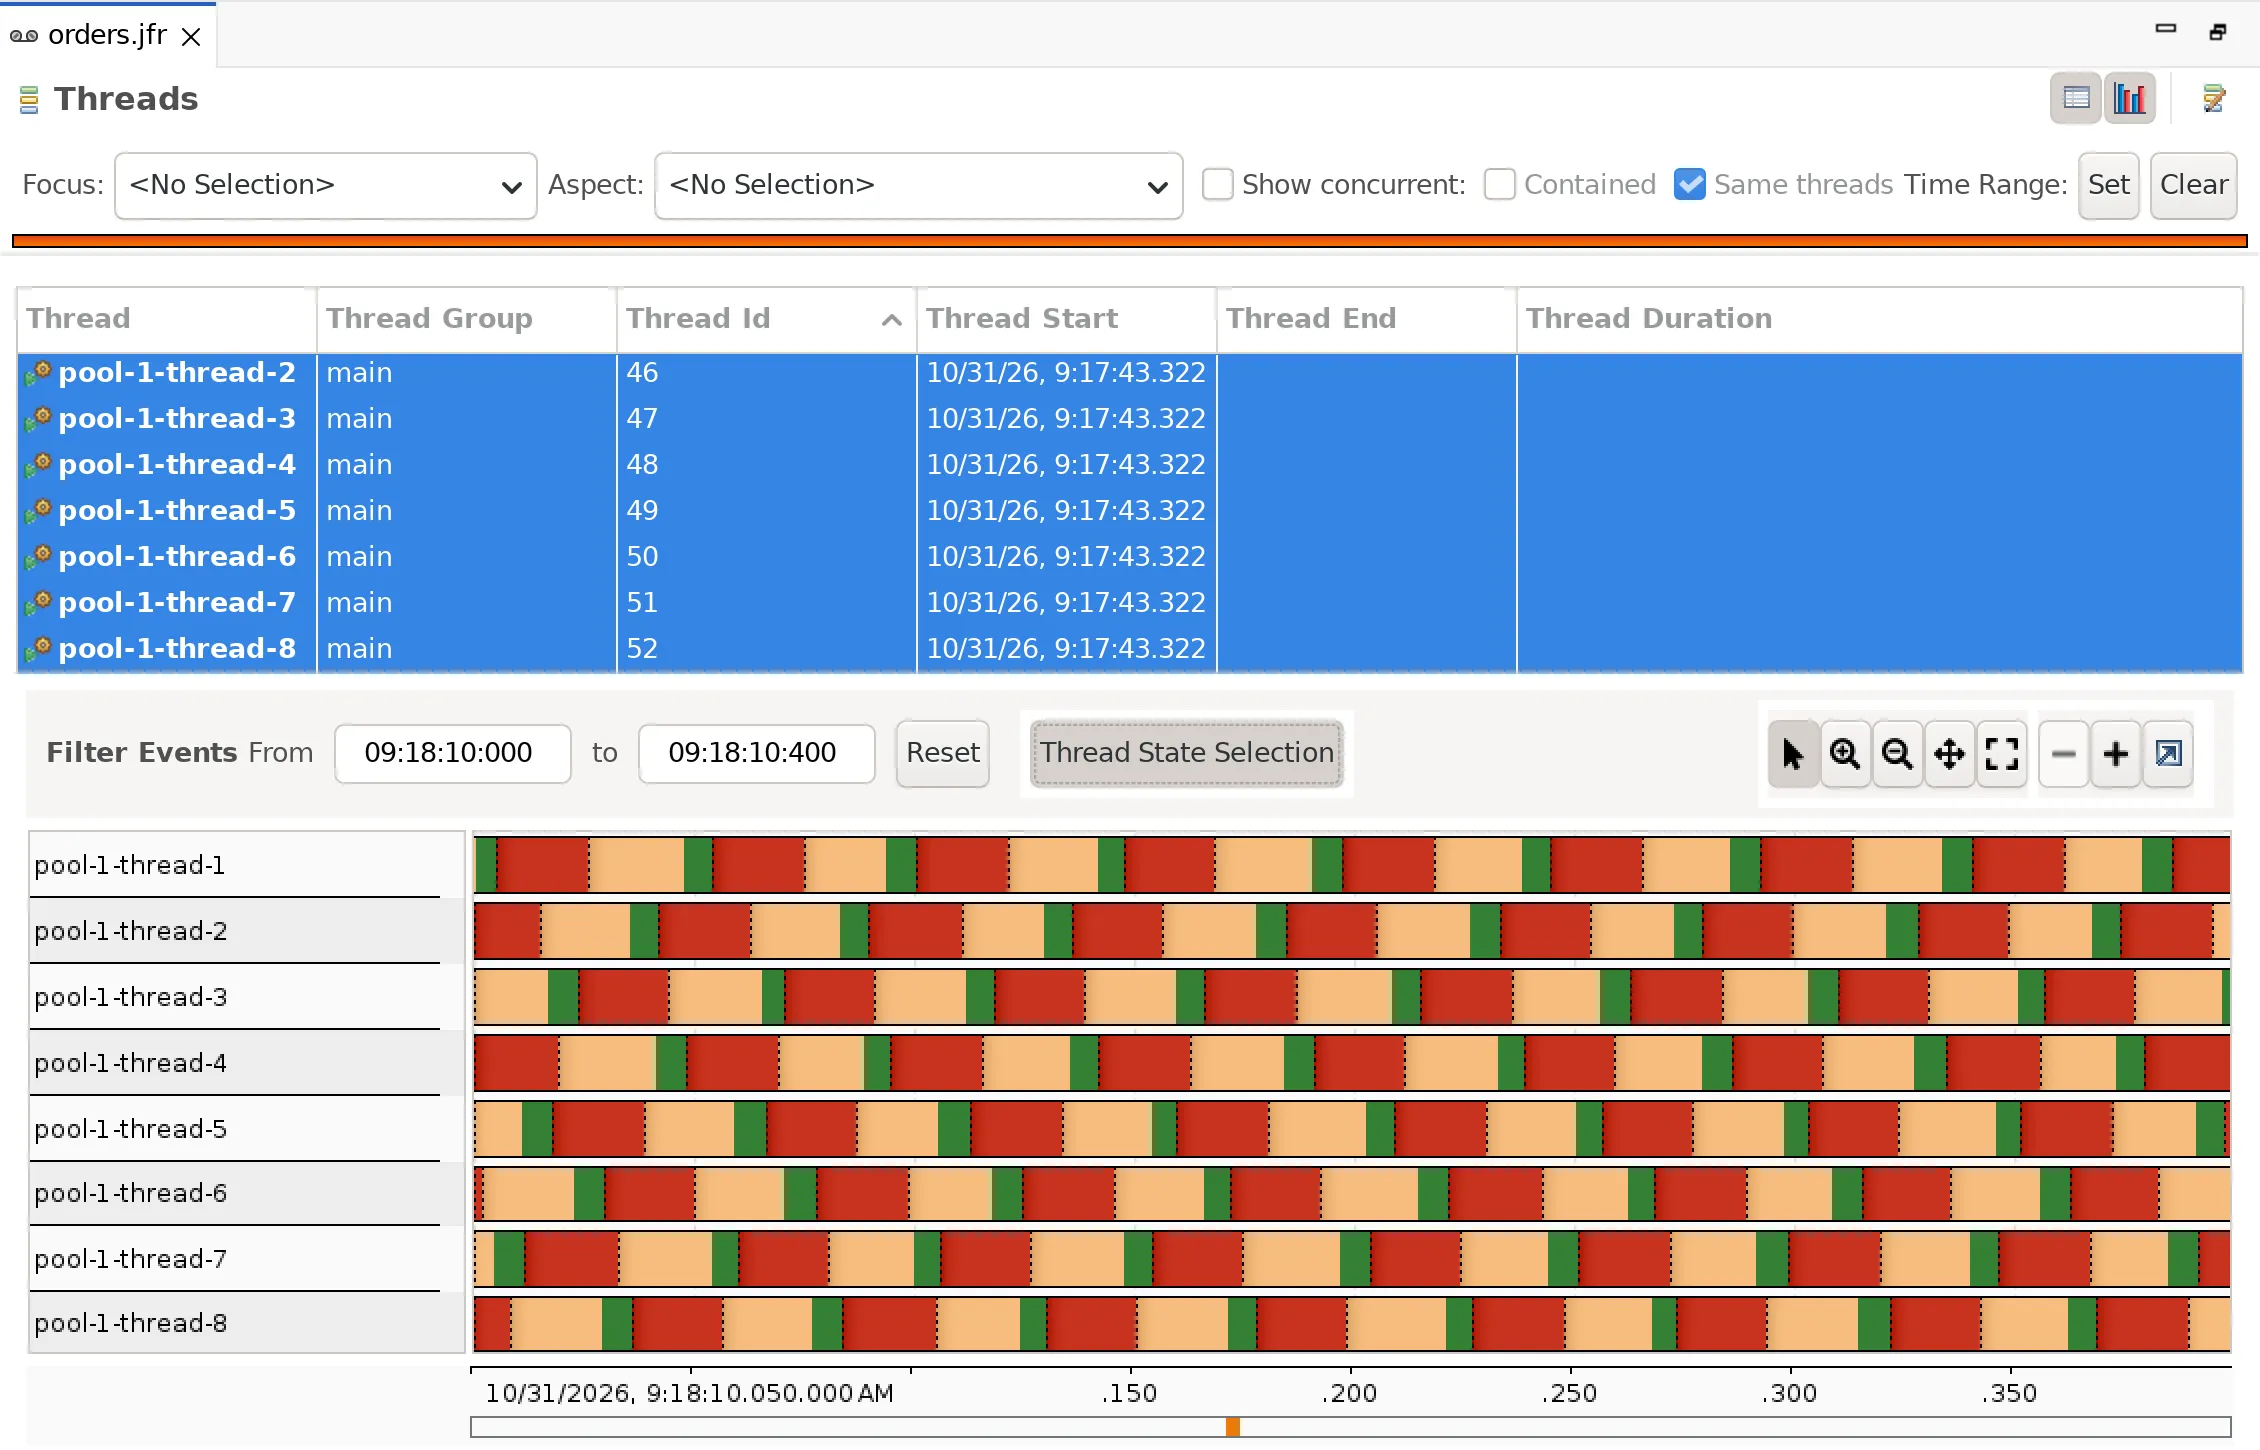
Red marks the read operations (“Socket Read”), beige the waiting for the lock (“Java Monitor Blocked”). The “Thread State Selection” button shows which color belongs to which event.
The green sections, on the other hand, are not events. Green is the base color of the timeline from the start to the end of the thread; it shows through wherever the Flight Recorder did not record an event with a duration for the thread. In the example, the thread is computing at these moments, e.g., in isBlocked() or formatReceipt(), or it sleeps through the 5 ms of the simulated database access in InvoiceNumberGenerator.next(). No event is created for that, because the recording only captures Thread.sleep() from 10 ms onward.
Exceptions: Which Exceptions Are Thrown?
The “Exceptions” page shows a table at the top, which you group “By Class”, “By Message”, or “By Class and Message” with the icon buttons at the top right, and below it the exceptions and errors over time.
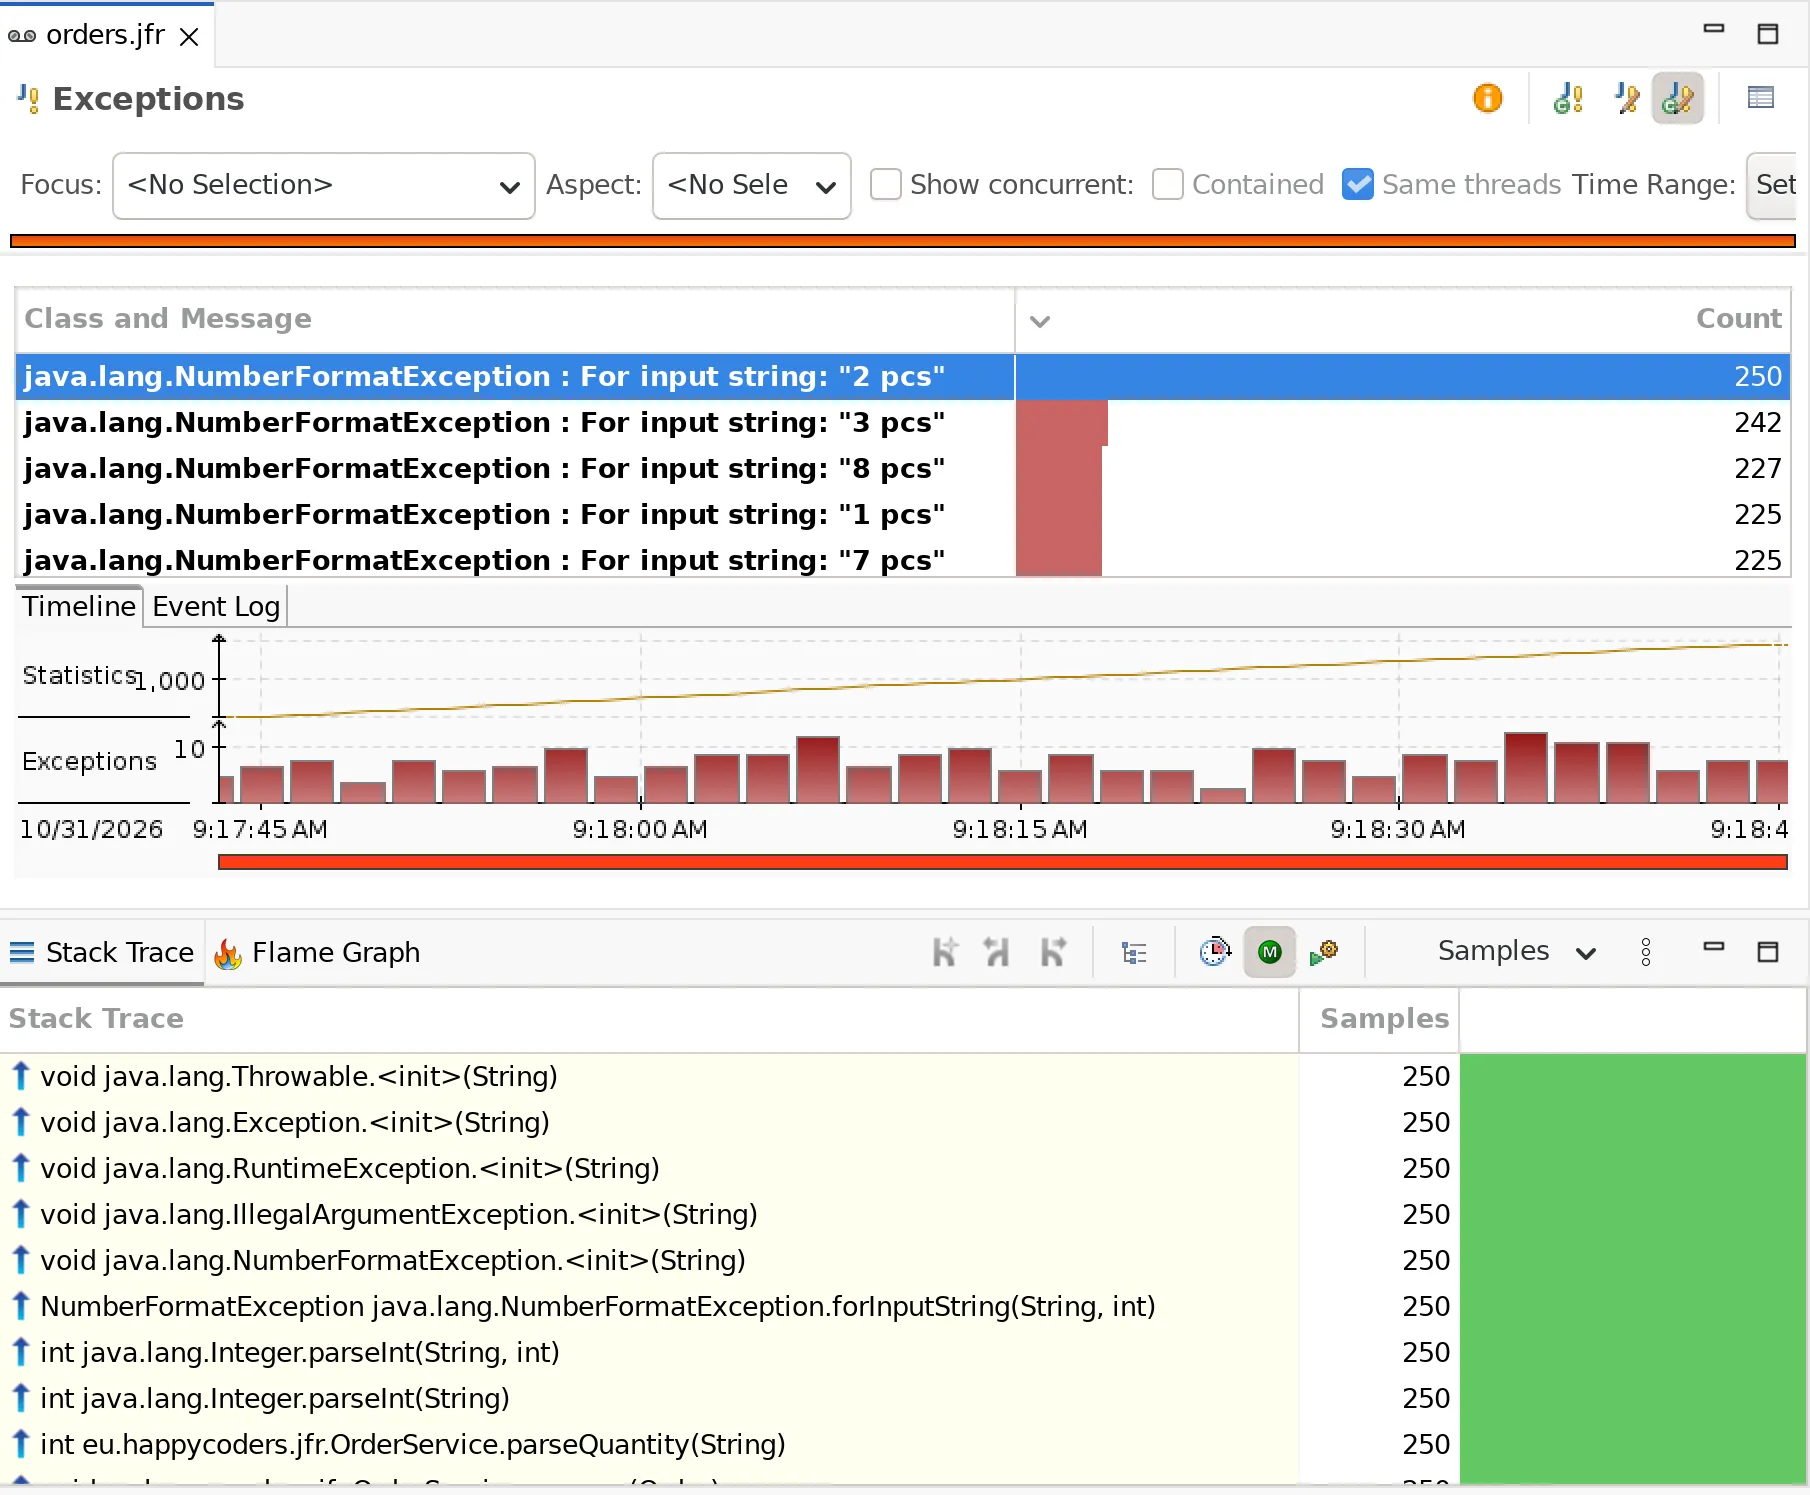
Grouped by class, java.lang.NumberFormatException is at the top with 1,977 exceptions. Grouped by message, you can see why the parsing fails: because of quantities with a unit, e.g., For input string: "2 pcs" with 250 exceptions. The “Stack Trace” view leads to the parseQuantity() method, which catches the NumberFormatException and returns the fallback value 1.
An exception as control flow is expensive, because every exception creates a stack trace. It is better to detect invalid input before parsing.
Garbage Collections: Is the GC Slowing Down the Application?
The “Garbage Collections” page under “JVM Internals” lists each garbage collection with columns such as “Cause”, “Collector Name”, “Longest Pause”, and “Sum of Pauses”. In addition, it shows the heap, the heap after each collection (“Heap Post GC”), the metaspace, and the pauses on a timeline.
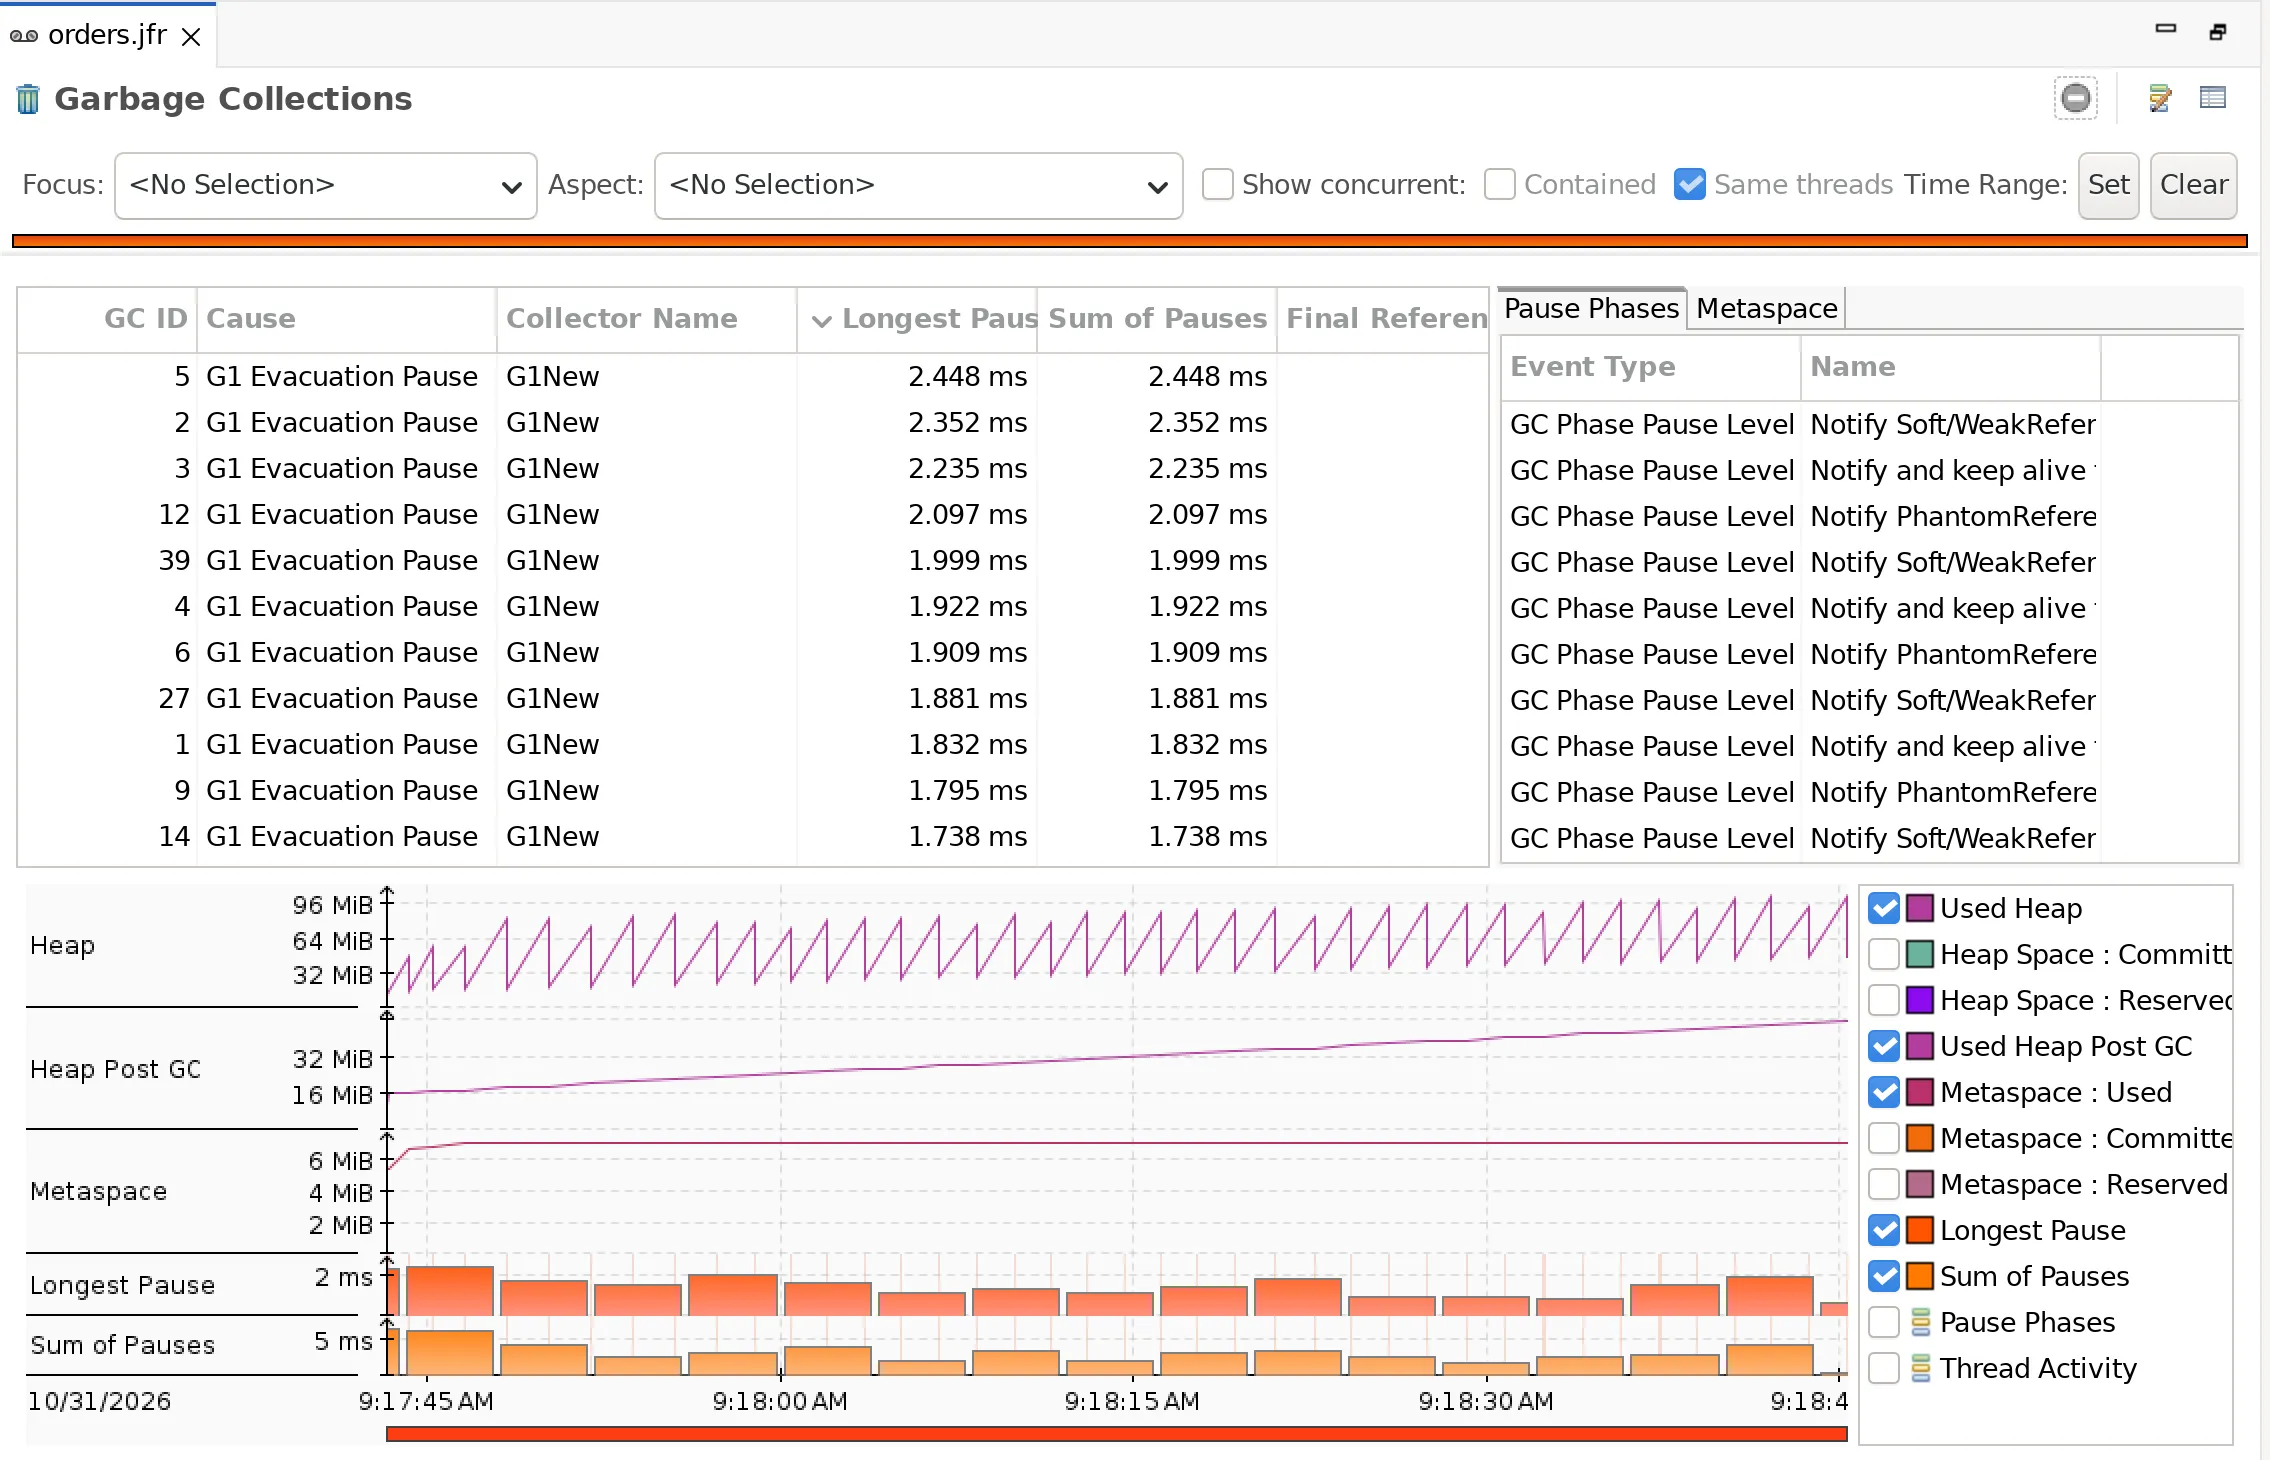
In the example, 42 garbage collections ran, all of type G1New with the cause “G1 Evacuation Pause”. The longest pause took 2.45 ms, all pauses together 57.7 ms – with 62 seconds of recording, that is 0.09% of the runtime. So optimizing the garbage collector is not worthwhile here.
The “Garbage Collections” page thus shows two things: the pauses are short, but the heap after each collection – the live set – grows. The growing heap is not a GC problem, but the cache from the section on Live Objects.
The Event Browser: All Events, Including Your Own
The Event Browser lists all event types of the recording in a tree, with the number of their events, and shows the events of the selected type as a table. This is also where you find custom events, in the example the OrderEvent with the name eu.happycoders.Order. JMC shows it under its label “Order” in the category “Uncategorized”, with 10,232 events – one per processed order. The section Custom Events of the JFR article describes how to write such an event. The quickest way to find the event is the search field above the tree:
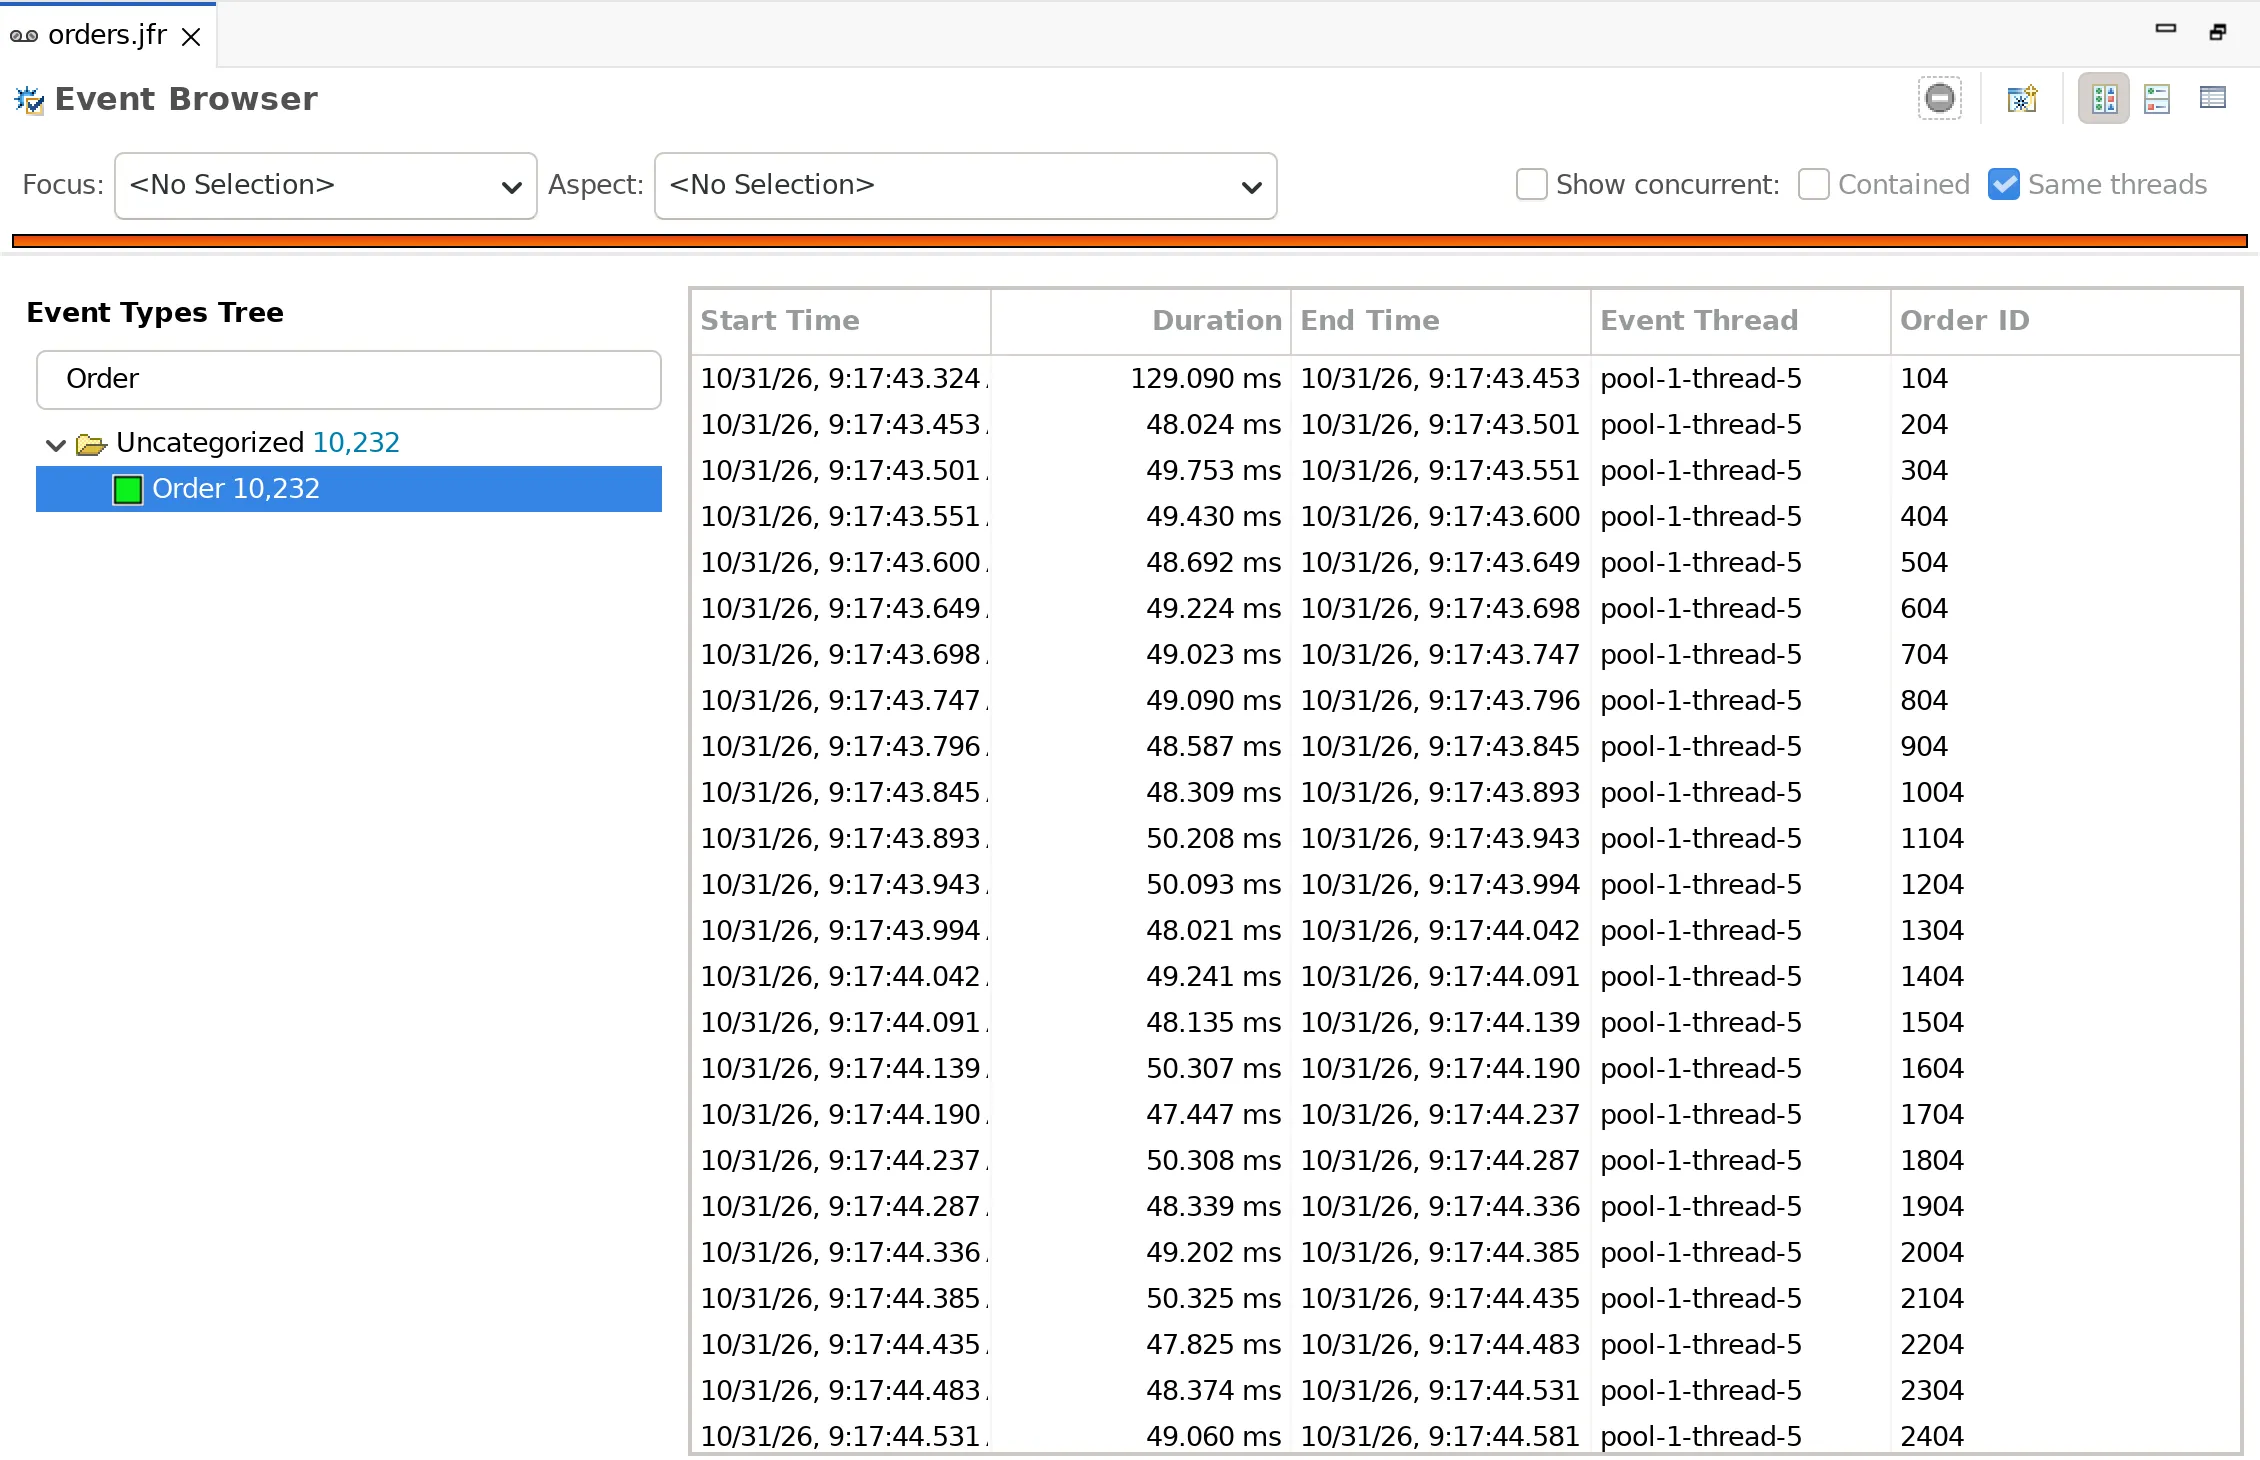
With “Create a new page using the selected event types”, you turn a selection of event types into a separate analysis page in the Outline – useful for events that none of the existing analysis pages evaluate.
The JMX Console: Looking Into the JVM Live
In addition to analyzing Flight Recorder recordings, JMC contains a JMX console. You start it in the JVM Browser by right-clicking a JVM and selecting “Start JMX Console”. It does not show a recording but live data from the JVM:
- Overview: charts of CPU load and heap.
- MBean Browser: all MBeans of the JVM with their attributes and operations.
- System, Memory, and Threads: system data, memory pools, and the running threads.
- Diagnostic Commands: the same diagnostic commands that you call with
jcmdon the command line.
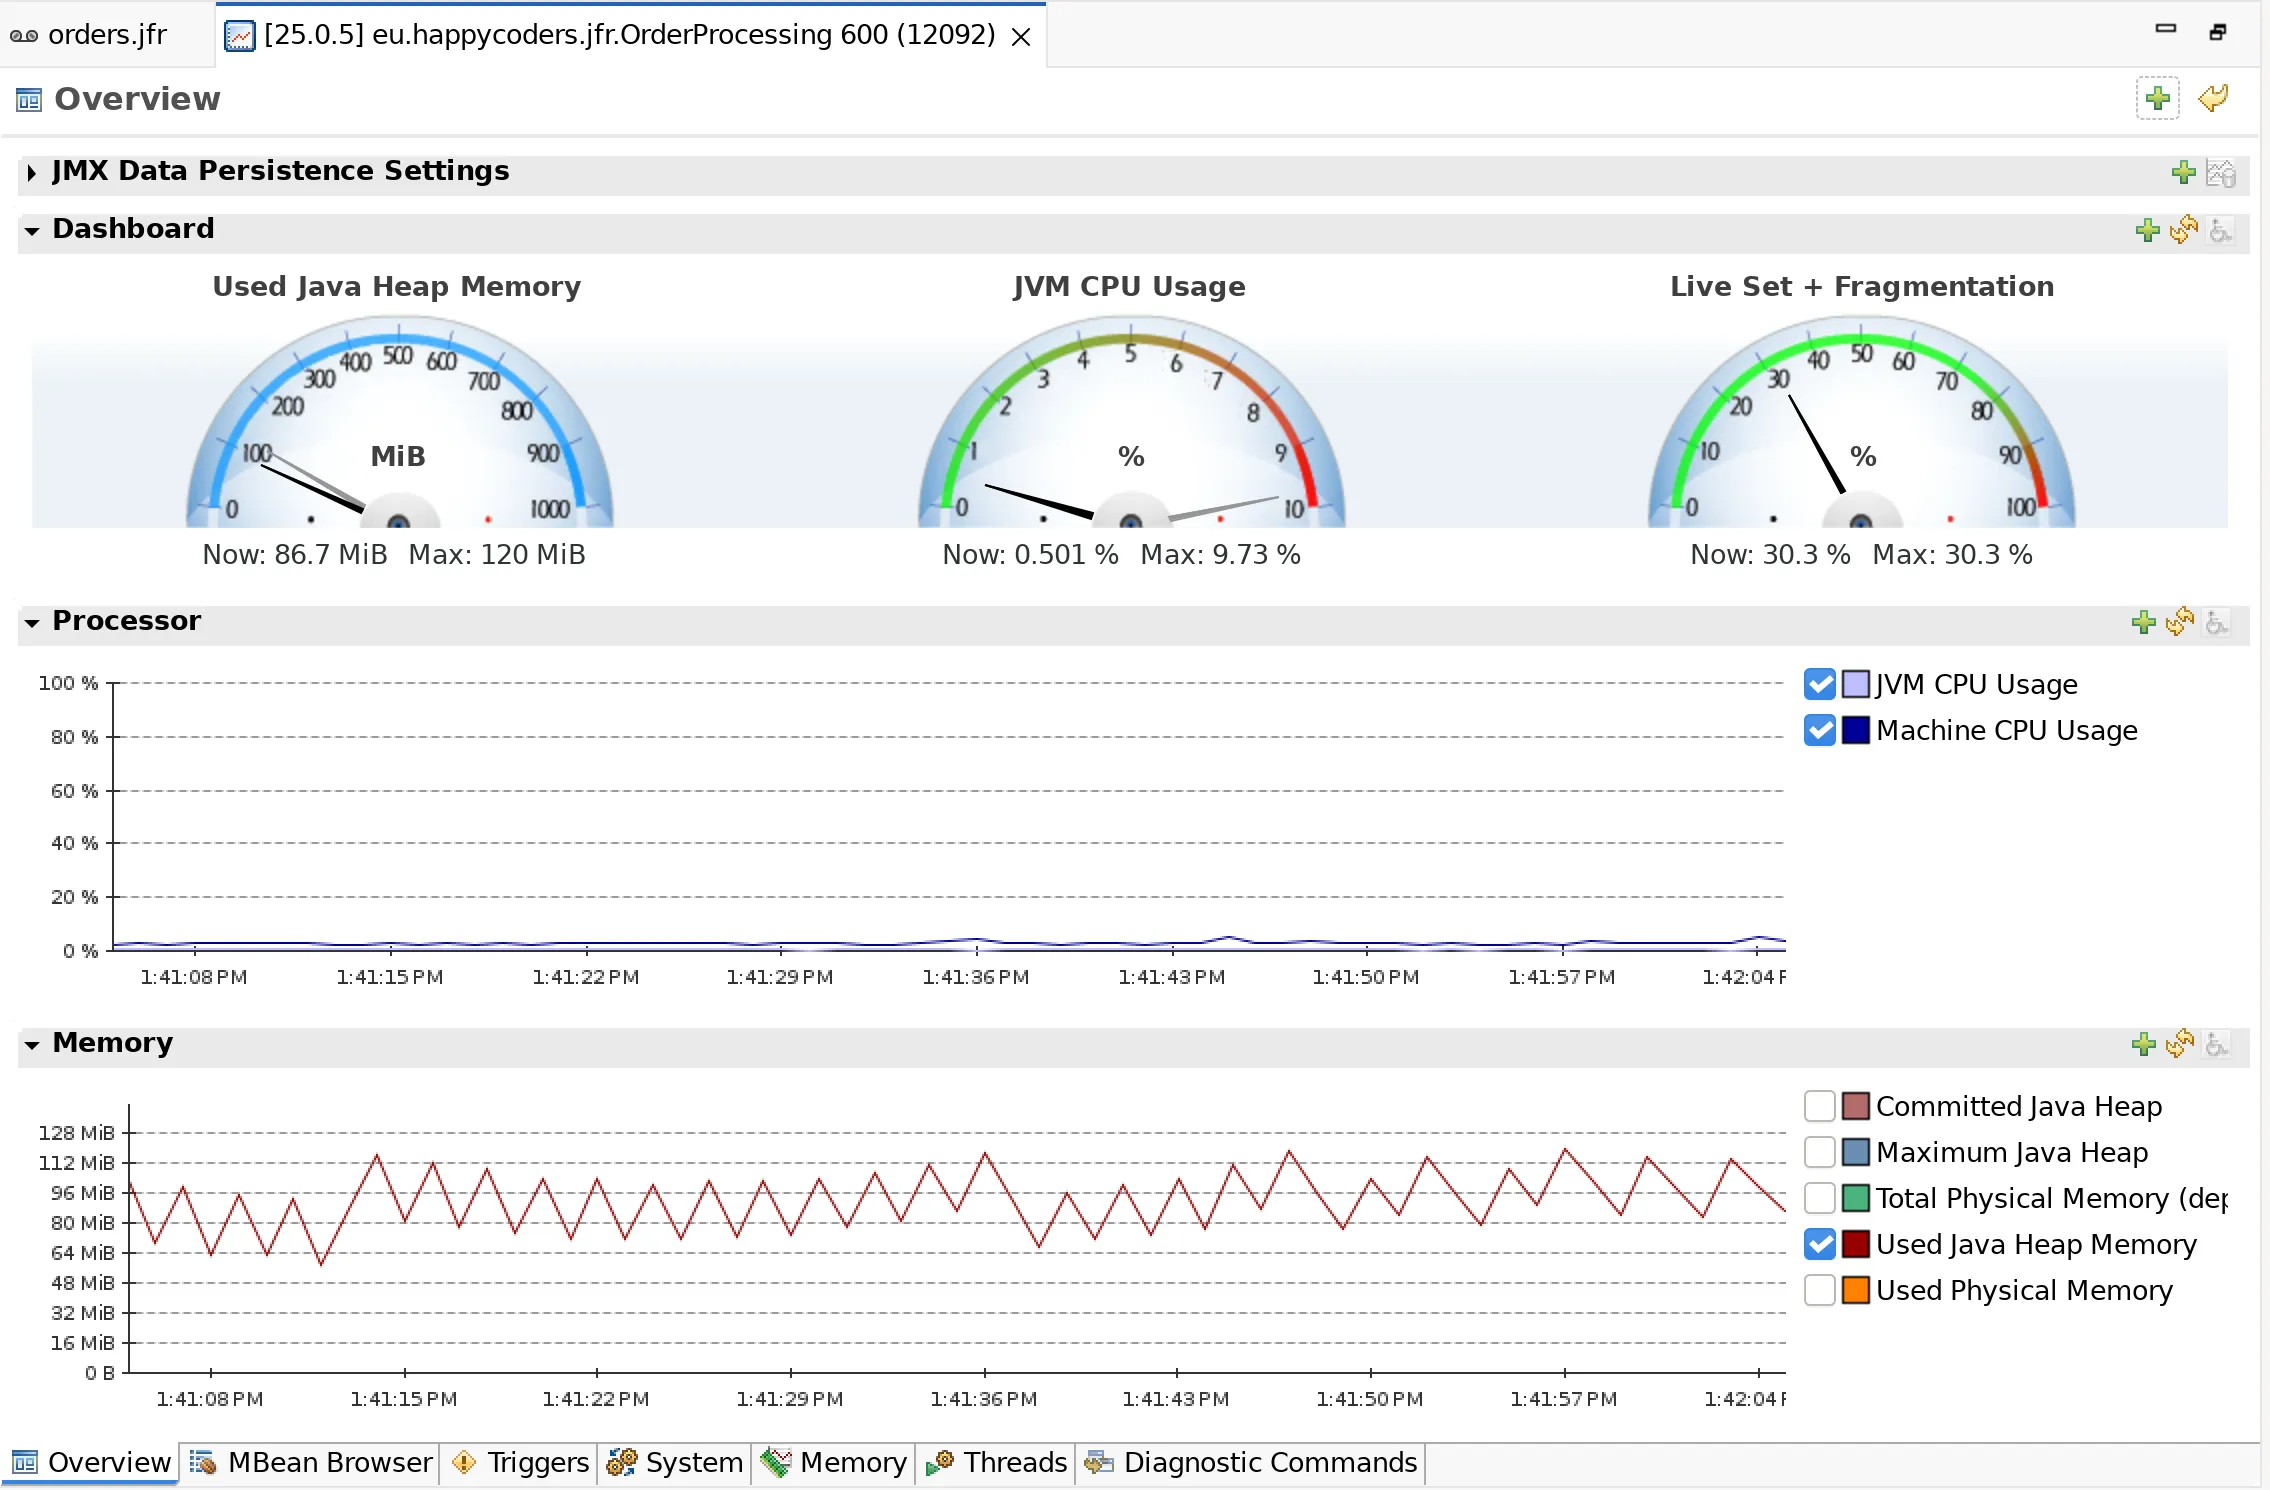
You don’t need the JMX Console to troubleshoot a recording. It is the tool for looking into a running JVM, e.g., at the heap during a load test.
jfr or JMC?
Both tools – jfr and JMC – read the same file. Which one you use depends on where you work and what you are looking for:
jfr | JMC | |
|---|---|---|
| Installation | part of the JDK | separate download, requires Java 21 |
| Operation | terminal, also via SSH on the server | graphical user interface |
| Output for other tools | JSON, XML | HTML report of the Automated Analysis |
| Automatic assessment | ✗ | Automated Analysis |
| Callers of a method | jfr print --stack-depth | Predecessors, Stack Trace, Flame Graph |
| Path to the GC root | jfr print, one chain per event | Live Objects, one tree across all chains |
| Live connection to the JVM | jcmd | JVM Browser, JMX Console |
I use jfr when I work directly on the server on which the recording was created and I have a specific question – for example, which methods consume the most CPU time. I use JMC when I don’t know a recording yet and first need an overview, or when I follow a problem through the stack traces.
Summary
JDK Mission Control (JMC) is the graphical user interface for the Java Flight Recorder. You have to download it separately, e.g., from jdk.java.net or from Adoptium, and you start it with Java 21 or newer. JMC opens .jfr files, starts recordings on running JVMs, and contains a JMX console.
In the example’s recording, the Automated Analysis found three of the five problems: the lock, the growing cache, and – via the StringConcatHelper class – the string concatenation. It did not report the linear search and the exceptions as control flow.
The analysis pages showed all five problems:
- Method Profiling and flame graph: More than half of the computing time goes into
isBlocked(), a linear search in anArrayListwith 200,000 entries; aHashSet, on the other hand, would find an element via its hash value. - Memory: 80% of the allocated bytes are created during the string concatenation in
formatReceipt(); aStringBuilderwould create the text in a single pass. - Live Objects: The receipts remain in a cache without an upper bound; it would need an upper bound or an expiration time for its entries.
- Lock Instances: All eight threads wait on a lock around a slow database access; a sequence in the database or a generator that reserves numbers in blocks would fix this.
- Exceptions: Almost 2,000
NumberFormatExceptions in 62 seconds reveal an exception as control flow; it is better to detect invalid input before parsing.
My recommendations:
- Start with the Automated Analysis, but don’t rely on it: a score below 25 does not mean that there is nothing to find on the corresponding analysis page.
- Read the “Method Profiling” page in the flame graph, not just in the table – the table usually names a JDK method, the flame graph your code.
- For the “Live Objects” page, record with
path-to-gc-roots=true, preferably viajcmd … JFR.dumpfrom the running JVM. - Check the field name in the reference tree of “Live Objects” when an object has several children; JMC 9.1.2 shows the field name of the child it attached first.
- Record on a machine that otherwise has little to do – otherwise, rules like “Competing Processes” fire because of the load of other processes on the machine instead of because of your program.
If this article has helped you, I would greatly appreciate a positive review on my ProvenExpert profile. Your feedback helps me improve my content and motivates me to write new informative articles.