
With Java 28, the JVM no longer stores only loaded classes and method profiles in the AOT cache, but also fully compiled machine code. JEP 544: Ahead-of-Time Code Compilation has been integrated into the JDK 28 code base since October 2026; according to the schedule, Java 28 is to be released on March 9, 2027.
In my example program, the precompiled code halves the execution time of the first round: 252 instead of 527 milliseconds. You do not have to change anything for this – the same training run that has created the AOT cache since Java 25 now also puts the machine code into the cache.
The JIT compiler keeps running nevertheless. As soon as a method has been called often enough, HotSpot replaces the precompiled code with newly compiled code – and in my measurement, the application is slower during this time than with a cache without precompiled code.
In this article, you will learn:
- What happens during the startup and warmup of a Java application, and which part of it now moves into the AOT cache
- How to create the cache with machine code and how to tell from the log that the JVM loads it
- How much the precompiled code helps in an example – measured without a cache, with a cache without machine code, and with machine code
- Why HotSpot gradually replaces the precompiled code
- How long the training run should be
- Under which conditions the JVM silently skips the machine code
- How JEP 544 differs from GraalVM Native Image and the former
jaotc
You can find the example program, the measurement scripts, and all measurement results in the GitHub repository java-aot-cache.
Startup, Warmup, Peak Performance
In the HotSpot JVM, a Java application goes through three phases:
- Startup: The JVM loads, links, and initializes each class only when the program uses it for the first time, and it initially executes the code in the bytecode interpreter. While doing so, it counts how often methods are called and loops are executed. The C1 compiler quickly compiles frequently called methods into moderately optimized machine code (“C1 code”).
- Warmup: The C1 code collects further profile data, e.g., which types actually occur at a call site. With this data, the C2 compiler compiles the most frequently used methods into highly optimized code (“C2 code”).
- Peak performance: Eventually, the most frequently used (the “hot”) methods are available as C2 code, and the compilers have nothing left to do.
If the behavior of the application changes, HotSpot discards code whose assumptions no longer hold – the so-called deoptimization – and compiles the affected methods again with the new profile data.
Until peak performance is reached, this work costs time: The interpreter and C1’s profiling code are slower than optimized code, and the compiler threads need CPU time that the application then lacks. And the JVM goes through this entire process – loading classes, interpreting, profiling, compiling – from the beginning at every startup.
What the AOT Cache Stores Before Java 28
Project Leyden moves this work step by step into a training run. The results of this training run are stored in the so-called AOT cache, a file that the JVM reads at later startups:
- Java 24 stores the classes in loaded and linked form with JEP 483.
- Java 25 adds the method profiles with JEP 515, so that C2 can compile right after startup. In the same release, JEP 514 combines the training run and cache creation into one command.
- Since Java 26, the AOT cache can be created and used with any garbage collector thanks to JEP 516, including ZGC.
I show how these steps work in detail and what they save at startup in the article Ahead-of-Time Class Loading & Linking.
What JEP 544 Adds
With the profiles from the cache available since Java 25, the C2 compiler can get going earlier – but it has to compile the hot methods again at every startup. JEP 544 moves this step forward as well: When the cache is created, C1 and C2 compile the methods that ran frequently in the training run, and the JVM puts the machine code into the cache along with everything else.
The JEP calls the cached code AOT code and the code that the JIT compiler generates at run time JIT code. I use the same terms below.
According to the JEP, the AOT code has four properties:
- No new switch: The JVM generates the AOT code by default, with the same commands as since Java 25.
- The same compilers: The AOT code is generated by the same compilers as the JIT code, C1 and C2. That is why the two fit together: AOT code can call JIT code and vice versa, and HotSpot can replace a method’s AOT code with JIT code without the application noticing.
- No AOT-only mode: Whatever is not in the cache, HotSpot interprets and compiles as usual.
- No cross-compilation: The AOT code runs only on the same CPU architecture with the same CPU features as when it was generated. AArch64 and x64 are supported initially.
Generating AOT Code: Step by Step
A program that executes little code hardly benefits from the AOT code – the numbers for this are in the section Programs That Execute Little Code. I have therefore written an example program that loads and compiles a lot of code: In each round, it compiles 50 generated source files in memory with the javac compiler and prints how long the round took. The same idea is behind the javac benchmark that the JEP authors use to measure warmup.
The program is a compact source file. main() calls compile() as often as the first argument specifies, and compile() passes the 50 source files to the compiler:
void main(String[] args) {
  int iterations = args.length > 0 ? Integer.parseInt(args[0]) : 10;
  JavaCompiler compiler = ToolProvider.getSystemJavaCompiler();
  for (int i = 1; i <= iterations; i++) {
    long start = System.nanoTime();
    boolean success = compile(compiler);
    long millis = (System.nanoTime() - start) / 1_000_000;
    String result = success ? "ok" : "failed";
    IO.println("Iteration %2d: %4d ms (%s)".formatted(i, millis, result));
  }
}

boolean compile(JavaCompiler compiler) {
  var sources = new ArrayList<JavaFileObject>();
  for (int n = 0; n < 50; n++) {
    sources.add(new SourceFile("Shapes" + n, SOURCE_TEMPLATE.formatted(n)));
  }
  var standardFileManager = compiler.getStandardFileManager(null, null, null);
  var fileManager = new DiscardingFileManager(standardFileManager);
  return compiler.getTask(null, fileManager, null, null, null, sources).call();
}
Three things are not printed here – you can find them in the complete file AotCompile.java in the repository:
- The constant
SOURCE_TEMPLATEis the template of the 50 source files: a class with a sealed interface, three records, aswitchwith record patterns, and a stream. - The class
SourceFileprovides the compiler with a source file from a string. - The class
DiscardingFileManagerdiscards the generated.classfiles instead of writing them to the file system.
You need an early-access build of Java 28 (jdk.java.net/28); I use build 28-ea+20. The following commands compile the file and package the classes into a JAR file:
javac -d classes AotCompile.java
jar cf AotCompile.jar -C classes .
The JAR file is necessary: If a directory with classes is on the class path instead of a JAR, the JVM aborts the creation of the cache with the message “Cannot have non-empty directory in paths”.
As in Java 25, you start the training run with -XX:AOTCacheOutput, here with 20 rounds:
java -XX:AOTCacheOutput=AotCompile.aot -cp AotCompile.jar AotCompile 20After the 20 rounds, the JVM reports that it is starting a second process. This process reads the observations of the training run and creates the cache from them – compiling the AOT code along the way. The last lines of the output look like this:
Reading AOTConfiguration AotCompile.aot.config and writing AOTCache AotCompile.aot
AOTCache creation is complete: AotCompile.aot 87998464 bytes
Removed temporary AOT configuration file AotCompile.aot.config
Between the first and the second of these lines, the JVM prints three warnings of the form “Cannot aot-resolve Lambda proxy because … is not loaded” in my run. They concern lambda expressions in javac whose classes the training run has not loaded. The JVM does not resolve these lambdas in advance in the cache, but – as without a cache – only when the program needs them.
The cache is about 88 MB in size. For comparison: A cache from a training run with the same 20 rounds, but without AOT code, has 38 MB in my measurement.
Now you start the program once without and once with the cache, each with five rounds:
java -cp AotCompile.jar AotCompile 5
java -XX:AOTCache=AotCompile.aot -cp AotCompile.jar AotCompile 5
Without a cache, the program prints the following:
Iteration  1:  620 ms (ok)
Iteration  2:  280 ms (ok)
Iteration  3:  218 ms (ok)
Iteration  4:  158 ms (ok)
Iteration  5:  132 ms (ok)
With the cache, the output looks like this:
Iteration  1:  330 ms (ok)
Iteration  2:  215 ms (ok)
Iteration  3:  180 ms (ok)
Iteration  4:  126 ms (ok)
Iteration  5:  103 ms (ok)
With the cache, the first round takes only a little more than half as long. Individual runs fluctuate; the medians of many runs are in the next section.
Telling From the Log That the JVM Loads AOT Code
The option -Xlog:aot shows whether the JVM loads AOT code. It prints many lines; those about the AOT code contain the words “AOT Code”. With stdout:none, the JVM writes them to standard output and without timestamps and tags:
java -Xlog:aot:stdout:none -XX:AOTCache=AotCompile.aot \
     -cp AotCompile.jar AotCompile 1 | grep "AOT Code"
The output looks like this:
Mapped 49955040 bytes at address 0x000000013ee70010 from AOT Code Cache
Loaded 7812 AOT code entries from AOT Code Cache
Read 1915 preload entries from AOT Code Cache
So about 50 of the 88 MB in the cache are AOT code. Behind the 1,915 “preload entries” is a second version of the AOT code, the so-called preload code.
The option -XX:+PrintCompilation shows when the JVM uses a method’s preload code and when its AOT code. It prints a line for each method that HotSpot compiles or loads from the cache. The following table shows these lines for the javac method Names.fromString() from my run with 40 rounds. It has these columns:
- Time: milliseconds since the start of the JVM
- ID: the sequential number that HotSpot assigns to the code when compiling or loading it; when HotSpot discards the code, the line shows that code’s number again
- Flags:
Afor AOT code from the cache,APfor preload code from the cache, empty for JIT code - Level: 1 to 3 are variants of C1, 4 is C2
- Event: whether the code was loaded or compiled, or discarded
| Time | ID | Flags | Level | Event |
|---|---|---|---|---|
| 26 | 350 | AP | 4 | preload code loaded from the cache |
| 145 | 4527 | A | 4 | AOT code loaded from the cache |
| 145 | 350 | AP | 4 | preload code discarded (“made not entrant: not used”) |
| 772 | 8584 | 4 | compiled by C2 | |
| 778 | 4527 | A | 4 | AOT code discarded (“made not entrant: not used”) |
So the method changes its code twice: After 145 milliseconds, HotSpot replaces the preload code with AOT code, and after 772 milliseconds, it replaces the AOT code with C2 JIT code.
Why there are two versions of the AOT code and why HotSpot replaces it again is explained in the section Why HotSpot Replaces the AOT Code Again.
How Much Does the AOT Code Help?
To separate the share of the AOT code from the rest of the cache’s content – the loaded and linked classes, the method profiles, and the pre-initialized objects – I measured three variants: without a cache, with a cache without AOT code, and with a cache with AOT code. The cache without AOT code is created by the same training run with the diagnostic option -XX:-AOTCodeCaching:
java -XX:+UnlockDiagnosticVMOptions -XX:-AOTCodeCaching \
     -XX:AOTCacheOutput=AotCompile-nocode.aot -cp AotCompile.jar AotCompile 20
The table shows how long a round takes in each variant, in milliseconds. For the rows with several rounds, it is the mean per round:
| Rounds | no cache | cache without AOT code | cache with AOT code |
|---|---|---|---|
| 1 | 527 | 489 | 252 |
| 2 to 5 | 151 | 132 | 106 |
| 6 to 10 | 87 | 83 | 77 |
| 11 to 20 | 73 | 66 | 74 |
| 21 to 30 | 65 | 67 | 71 |
| 31 to 40 | 61 | 64 | 64 |
With AOT code, the first round takes 52% less time than without a cache, with the cache without AOT code only 7%. That is an impressive acceleration of the program’s initial phase.
In rounds 2 to 10, the lead remains but becomes smaller: In rounds 2 to 5, a round with AOT code takes 106 milliseconds on average, without a cache 151, and with the cache without AOT code 132; in rounds 6 to 10, it is 77, 87, and 83 milliseconds.
In rounds 11 to 20, the picture reverses: With AOT code, a round takes 74 milliseconds, with the cache without AOT code only 66. I explain the reason in the section Why HotSpot Replaces the AOT Code Again. After that, the two caches converge again: In rounds 21 to 30, the gap is smaller, and from round 31 on, a round takes the same time with and without AOT code.
The following chart shows the first 40 rounds individually, as the median of each round. The blue line is the variant without a cache, the red one the cache without AOT code, and the yellow one the cache with AOT code:
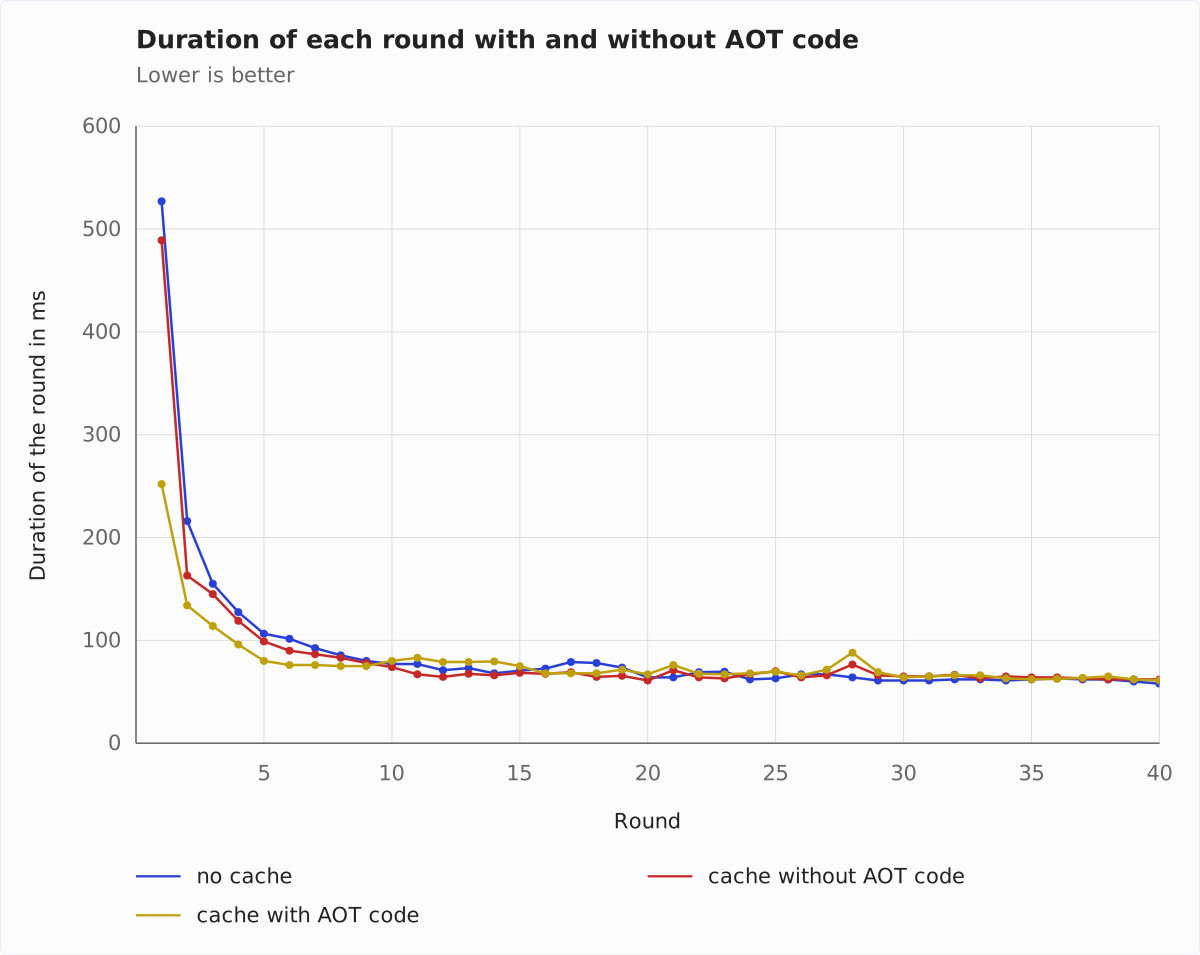
You can clearly see that in the initial phase, the program is much faster with the cache with AOT code (yellow line) than without a cache (blue line) and with the cache without AOT code (red line). From round 10 on, the lines are close together; until about round 30, the yellow line (cache with AOT code) mostly runs above the red one (cache without AOT code), after that the two lie almost on top of each other.
The JEP authors measure larger effects. For five applications based on common frameworks, the cache without AOT code shortens startup by 50 to 70%, with AOT code by 65 to 80%. In their javac benchmark, the cache without AOT code shortens the first round by about 30%, with AOT code by about 75%. They measured on a Linux system with two cores, on which the JIT compilers compete with the application for the CPU – my MacBook has 18 cores.
Programs That Execute Little Code
A program that executes little code hardly benefits from the AOT code, but mainly from the rest of the cache’s content – the loaded and linked classes, the method profiles, and the pre-initialized objects. The program AotTest from the article Ahead-of-Time Class Loading & Linking only prints the current date. It starts in 44.7 milliseconds without a cache, in 33.4 with a cache without AOT code, and in 32.9 milliseconds with AOT code.
Why HotSpot Replaces the AOT Code Again
AOT code can be less optimized than JIT code. That is because C2 does not compile it in the production run, but – as described in the section Generating AOT Code: Step by Step – after a training run in a separate process that creates the cache and in which the application itself no longer runs. C2 therefore lacks information that it would have in the production run.
The JEP gives two examples:
- Class initialization: If a method calls a static method of another class or reads a static field, the other class must be initialized first. Whether it already is depends on the order of the calls in the production run. The C2 compiler therefore generates two versions of the method: a slow one that checks before each access whether the class is initialized (the preload code mentioned earlier), and a fast one without this check (the AOT code). HotSpot first uses the slow version and switches to the fast one as soon as all required classes are initialized.
- Static final fields: In the production run, the C2 compiler knows the value of a
static finalfield and inserts it as a constant directly into the machine code. When the cache is created, no class is initialized, and the value can be different in every run, e.g., the time the application was started. The AOT code therefore has to read the field every time.
There is also a third reason that the JEP does not mention: The profile with which the C2 compiler compiles the AOT code comes from the training run. A production run usually lasts longer, and its profile can look completely different.
So that the application still reaches its peak performance, HotSpot gradually replaces the AOT code with JIT code. To do this, each AOT-compiled C2 method counts its calls. If the counter exceeds a limit, HotSpot recompiles the method with the JIT compiler and discards the AOT code. The limit depends on the number of calls in the training run and lies between about 100 and about one million.
The counting has its price: It costs a read access, a write access, and a comparison on every call. C2 JIT code does not count its calls. As long as a method runs as AOT code, it is therefore also slower than JIT code for this reason.
In my run with 40 rounds, HotSpot loads 1,625 C2 methods as AOT code. It later replaces 889 of them with C2 JIT code – 808 of them already within the first 20 rounds. The method Names.fromString() from the table above is one of them.
During this exchange, the example program is slower with AOT code than with the cache without AOT code: In rounds 11 to 20, a round takes 74 instead of 66 milliseconds on average.
From round 31 on, a round takes practically the same time with both caches. Without a cache, however, the program is faster from round 21 on and stays that way: In rounds 81 to 100, a round takes 56 milliseconds without a cache and 59 with either of the two caches – that is 5% more.
So this is not due to the AOT code, but to the method profiles from the training run. This is shown by the diagnostic option -XX:-AOTReplayTraining: With it, the JVM does not read the profiles from the cache, but still uses the loaded and linked classes. In another measurement series with 15 runs per variant, a round in rounds 81 to 100 takes 55.8 milliseconds without a cache, 58.9 with the cache without AOT code, and 56.1 milliseconds with the same cache but without the profiles. I have not investigated further why the profiles from the training run lead to slower code in the long run.
Without Counters, the AOT Code Stays Slower
A cache whose AOT code has no counters shows what happens without the exchange of AOT code for JIT code. The diagnostic option -XX:-UseAOTCodeCounters switches them off. It only takes effect when the cache is created, so you pass it via the environment variable JDK_AOT_VM_OPTIONS, which applies only to this step:
JDK_AOT_VM_OPTIONS='-XX:+UnlockDiagnosticVMOptions -XX:-UseAOTCodeCounters' \
  java -XX:AOTCacheOutput=AotCompile-nocounters.aot -cp AotCompile.jar AotCompile 20
The following chart shows 60 rounds with both caches, as the median of each round from eight runs. The blue line is the cache with counters, as the JVM creates it by default, the red one the cache without counters:
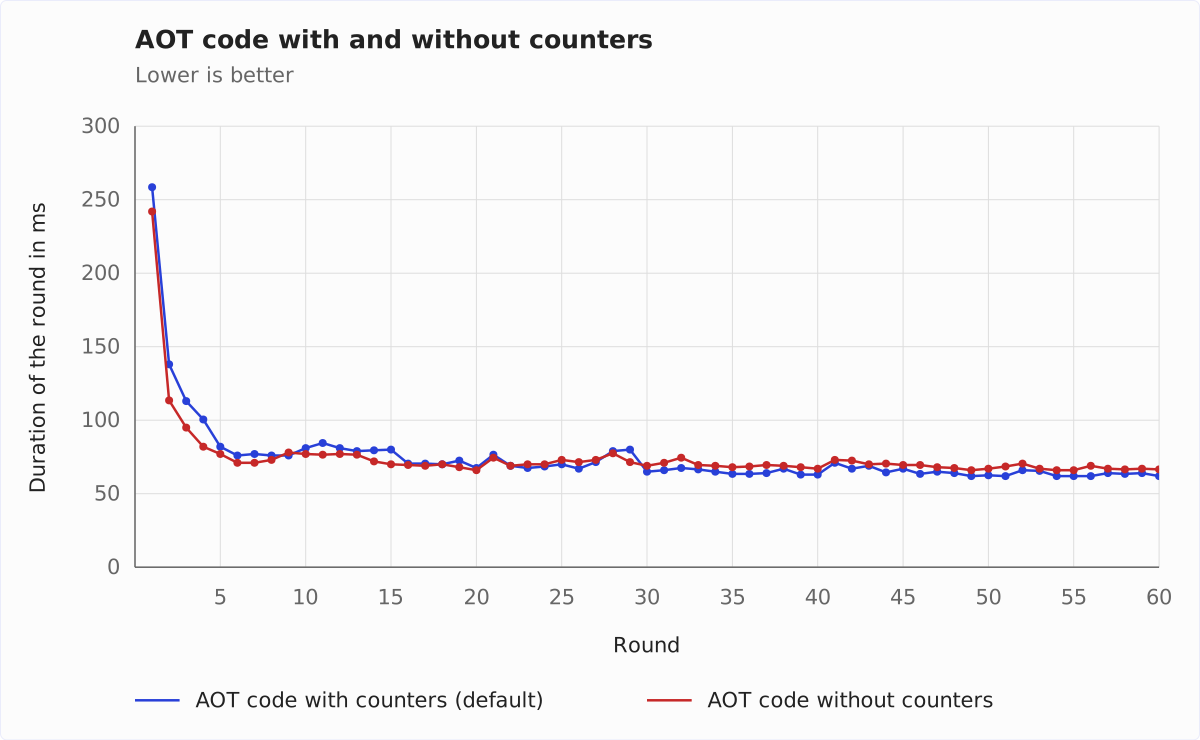
Without counters, the program is faster in the first 20 rounds: In rounds 2 to 5, a round takes 92 instead of 108 milliseconds on average, in rounds 11 to 20, 72 instead of 76 milliseconds on average. From about round 30 on, however, it stays slower – in rounds 51 to 60, a round takes 68 milliseconds, with counters 63 milliseconds. So without counters, the program is 8% slower there.
The reason: Without counters, HotSpot does not replace the AOT code with JIT code. In a run with 60 rounds, it loads 1,639 C2 methods as AOT code and replaces none of them; it discards only 75 through deoptimization because an assumption in the code no longer holds. The disadvantages of the AOT code from the list above therefore remain until the end.
How Long Should the Training Run Be?
The training run determines which methods C1 and C2 compile in advance and with which profile. To see how much its length matters, I created caches from training runs with 5, 20, and 60 rounds and let the program run for 60 rounds eight times with each cache.
The table shows the first round and the mean of rounds 6 to 10 in milliseconds as well as the size of the cache:
| Training | Round 1 | Rounds 6 to 10 | Cache size |
|---|---|---|---|
| 5 rounds | 266 ms | 106 ms | 66.4 MB |
| 20 rounds | 259 ms | 77 ms | 87.0 MB |
| 60 rounds | 256 ms | 76 ms | 101.2 MB |
A longer training run makes the program with the AOT code faster – but only up to a certain length. In the first round, the three caches are close together, between 256 and 266 milliseconds. The difference becomes clearer in the following rounds: In rounds 6 to 10, the program is 27% faster with the cache from a training run of 20 rounds than with the one from five rounds. With a training run of 60 rounds, it is only 1 millisecond faster there, and in rounds 2 to 5 even slower: 118 instead of 108 milliseconds.
This fits with the fact that shorter training runs deliver less AOT code: According to -Xlog:aot, the cache from five rounds contains 31 MB of AOT code, the one from 20 rounds 49 MB, and the one from 60 rounds 62 MB. By the way, the size of the AOT cache fluctuates from run to run: Three caches from training runs of 20 rounds each had 86.9 to 87.4 MB.
You should also keep in mind that generating the AOT code takes time: The training run and cache creation take about twice as long as for a cache without AOT code. In my measurement, both steps together take 7.9 to 8.1 seconds, without AOT code 4.0 seconds – and without an AOT cache at all 2.6 seconds.
I recommend a training run that covers the work the application does after startup – that is, the typical requests, not just the startup. If the cache is only meant to speed up the first round – in an application, the startup and the first requests – a short training run is enough. If it is also meant to shorten the time until the application reaches its peak performance, a longer training run pays off.
When the JVM Does Not Load the AOT Code
According to the JEP, the JVM uses the AOT code only under two conditions, in addition to those that apply to the entire cache according to JEP 483 (the same JDK release, the same hardware architecture, the same operating system, a class path that starts with the same JAR files, and the same module options):
- The training run and the production run use the same CPU architecture with the same CPU features. AOT code for an x64 CPU with AVX-512 (vector instructions that process 512 bits at once), for example, does not run on an x64 CPU without AVX-512.
- Both use the same garbage collector, because the AOT code contains barriers that belong to the respective GC.
If a condition is violated, the JVM continues to use the loaded and linked classes and the profile data from the cache, but not the AOT code. According to the JEP, HotSpot then issues a warning. In build 28-ea+20, the JVM only reports this if you explicitly request the messages with the VM option -Xlog:aot.
If you start the example program with the cache created under G1 and the Serial GC, no message appears:
java -XX:+UseSerialGC -XX:AOTCache=AotCompile.aot -cp AotCompile.jar AotCompile 1Iteration 1: 392 ms (ok)Only -Xlog:aot shows that the JVM has discarded the AOT code:
java -XX:+UseSerialGC -Xlog:aot:stdout:none -XX:AOTCache=AotCompile.aot \
     -cp AotCompile.jar AotCompile 1 | grep "AOT Code"
Mapped 49955040 bytes at address 0x000000012e3c8010 from AOT Code Cache
AOT Code Cache disabled: it was created with UseCondCardMark = true vs current false
Unable to use AOT Code CacheNote that the message does not name the garbage collector, but the option UseCondCardMark, which G1 switches on automatically and the Serial GC does not.
With -XX:AOTMode=required, on the other hand, the JVM aborts if it cannot fully use the cache. The value required has existed since Java 27; before that, it was called on. The last two lines of the output then read:
Error occurred during initialization of VM
Unable to use AOT Code Cache.
Before that, the JVM states the same reason as above in an error line.
With ZGC, the entire cache is affected, not just the AOT code. If you start the program with the cache created under G1 and -XX:+UseZGC, the JVM reports “Unable to use AOT cache.” and gives the reason “The saved state of UseCompressedOops (1) is different from runtime (0)”. G1 created the cache with Compressed Oops, ZGC works without them. The program then runs entirely without the cache. If you create the cache with ZGC, the JVM also loads the AOT code under ZGC.
My recommendation: Create the cache with the same garbage collector and on machines with the same CPU features on which the application runs in production. And start the application once with -XX:AOTMode=required after each deployment, for example in a smoke test – this way, unusable AOT code is noticed before it only costs startup time in production.
If you want to switch off the AOT code deliberately, e.g., to measure its effect in production, you start the application with -XX:+UnlockDiagnosticVMOptions -XX:-AOTCodeCaching. The JVM then continues to use the loaded and linked classes and the profile data from the cache.
And What About GraalVM Native Image and jaotc?
Precompiled code existed for Java before JEP 544, in two other forms:
- GraalVM Native Image compiles all reachable parts of an application together with parts of the Java runtime environment into an executable file at build time. After that, the application cannot load any further classes – the GraalVM documentation calls this the closed-world assumption. Classes and methods accessed via reflection must be specified in metadata at build time if the static analysis does not find them.
- The tool
jaotccame with Java 9 (JEP 295) and compiled classes in advance into a native library. It was experimental, limited to Linux/x64, and was removed again with Java 17 (JEP 410).
JEP 544 takes a different path. The AOT code is only a head start: HotSpot still loads classes dynamically, interprets, profiles, and recompiles where the AOT code does not fit. According to the JEP, neither the code of the application nor that of the libraries and frameworks has to be changed for this. No standalone executable file is created: The application still needs a JVM, and the cache has to be created by a training run.
Conclusion
With Java 28, the AOT cache stores not only classes and profiles but also machine code that C1 and C2 compile when the cache is created. In my example program, which compiles 50 source files in each round, the first round thus takes 252 instead of 527 milliseconds, and the program is also faster with AOT code than without a cache in the following rounds up to round 10.
If you already use the AOT cache, you get the AOT code with Java 28 without an additional command. It does, however, cost space and time during creation: The cache of my example program grows from 38 MB to 87–88 MB, and the training run and cache creation take 8 instead of 4 seconds.
The AOT code remains a head start at startup. HotSpot replaces it with JIT code as soon as a method has been called often enough – in my measurement, 889 of 1,625 C2 methods within 40 rounds. During this exchange, the program is temporarily slower than with a cache without AOT code.
Create the cache with the same garbage collector and on machines with the same CPU features as in production. If one of these does not match, the JVM discards the AOT code without reporting it. Therefore, start the application once with -XX:AOTMode=required after each deployment – then the JVM aborts with an error message in this case.
Did you take something away from this article? With a review on my ProvenExpert profile, you help other developers assess whether these articles are worth reading – and you help me understand which content is most useful to you.