
Since Java 25, the JVM stores not only loaded and linked classes in the AOT cache, but also the method profiles from the training run. JEP 515: Ahead-of-Time Method Profiling thus promises a shorter warmup: the JIT compiler does not have to collect the profiles first, but can work with them right after startup.
For the first rounds, this holds true: in an example program that compiles 50 source files in each round, rounds 2 to 5 take 14% less time on Java 25 with the profiles than without.
In the long run, however, the program becomes slower with the profiles than without a cache – on Java 28 by 5% after 200 rounds. I found the reason in the source code of the JVM: when the cache is written, the profiles lose their entries for lambda expressions, and the C2 compiler then no longer inlines these lambdas into the calling code.
In this article, you will learn:
- What a method profile is and what JEP 515 promises
- How to get the profiles into the AOT cache – and how to switch them off for comparison
- How much the profiles help in the example from the JEP and in a larger example
- What the JVM does with the profiles from the cache and why the first round becomes slower in Java 28
- Why the code is slower in the long run with the profiles – in a small example program and in the source code of the JVM
- How long the training run should be and whether the new iterative training in Java 28 helps
You can find the example programs, the measurement scripts, and all measurement results in the GitHub repository java-aot-cache.
Method Profiles and Tiered Compilation
HotSpot first executes Java code in the interpreter and compiles frequently called methods in two stages: first with the fast C1 compiler, then with the highly optimizing C2 compiler. I describe how this works in detail in the article Ahead-of-Time Code Compilation.
This article is mainly about the method profile: the interpreter and the C1 code count how often a method is called, how often each loop runs, which branches are taken, and which classes actually occur at a call site. Based on this profile, the C2 compiler then decides which called methods it embeds into the calling code – the so-called inlining.
In addition, the C2 compiler optimizes speculatively: if a call can reach methods of different classes (polymorphism), but according to the profile only one class has occurred so far, it inlines that class’s method and only checks the class beforehand. And a branch that according to the profile has never been taken is not compiled at all. If such an assumption no longer holds later, the JVM discards the C2 code and executes the method in the interpreter again – the so-called deoptimization.
The levels at which HotSpot executes a method are numbered:
- Level 0: interpreter, with profiling
- Level 1: C1 code without counters and without profiling
- Level 2: C1 code that only counts calls and loop iterations
- Level 3: C1 code with full profiling
- Level 4: C2 code, without profiling
Without profiles from the cache, a hot method usually goes through levels 0, 3, and 4. Level 1 is used for methods where C2 would not gain anything – getters, methods that only return a constant, and native methods – as well as for methods that C2 cannot compile. Level 2 only plays a bigger role with the profiles from the cache – more on that shortly.
What JEP 515 Promises
According to the JEP, the training run collects the method profiles, and the JVM stores them in the AOT cache. In the production run, it reads the profiles back in, so that the JIT compiler can compile hot methods right away. This requires no change to the code of the application, nor to that of libraries and frameworks. If you already use AOT Class Loading & Linking, you do not need a new workflow either: the profiles end up in the cache with the same commands that have put the classes there since Java 25.
The profiles from the cache do not prevent the JVM from continuing to profile and optimize in the production run.
As an example, the JEP names the program HelloStreamWarmup, which runs a short stream pipeline 100,000 times. With an AOT cache without profiles, it runs in 90 milliseconds according to the JEP, with profiles in 73 milliseconds – 23% faster. The cache grows by 250 KB, which is about 2.5%.
The JEP sees no new risks. It only names one assumption: that the training run is a good source of observations that benefit the production run. I come back to this assumption in the section Why the Code Becomes Slower in the Long Run.
Putting the Profiles into the AOT Cache
To put the method profiles into the AOT cache, you do not need a separate step. Since Java 25, the training run automatically adds the profiles to the cache when you create the AOT cache with -XX:AOTCacheOutput:
java -XX:AOTCacheOutput=App.aot -cp App.jar App
java -XX:AOTCache=App.aot -cp App.jar App
I show how the training run and the cache creation work in detail in the article Ahead-of-Time Class Loading & Linking.
To measure what the profiles bring, you need a comparison with the same cache, but without the profiles. The diagnostic option -XX:-AOTReplayTraining provides it: with it, the JVM uses the loaded and linked classes from the cache, but does not read the profiles.
java -XX:+UnlockDiagnosticVMOptions -XX:-AOTReplayTraining \
     -XX:AOTCache=App.aot -cp App.jar App
In Java 28, this option also switches off the precompiled code in the cache, which is added by JEP 544 – the JVM uses the AOT code only together with the profiles. For my measurements, I therefore created the Java 28 caches with -XX:-AOTCodeCaching, without AOT code. They then contain the same parts as a cache from Java 25: the loaded and linked classes, the preinitialized objects, and the method profiles.
In the following tables, the three variants are called:
- without a cache: the program without
-XX:AOTCache - without profiles: with a cache, but with
-XX:-AOTReplayTraining - with profiles: with the same cache, without any further option
Measured Again: The Example from the JEP
I took the program HelloStreamWarmup unchanged from the JEP; you can find it in the repository. The table shows how long the whole java process runs, in milliseconds:
| without a cache | without profiles | with profiles | |
|---|---|---|---|
| Java 25 | 49.7 | 45.2 | 43.5 |
| Java 28 | 50.3 | 44.6 | 40.2 |
With profiles, the program needs 3.8% less time than without profiles on Java 25, and 9.9% less on Java 28. So the direction is right, but on my machine the effect is smaller than in the JEP, where the program needs 19% less time with profiles. The JEP does not say on which hardware its authors measured.
A Larger Example: 100 Rounds of javac
HelloStreamWarmup runs for only 40 to 50 milliseconds. To see the warmup and the time after it, I use the program AotCompile from the article Ahead-of-Time Code Compilation. In each round, it compiles 50 generated source files in memory with the javac compiler and prints how long the round took. I created the cache with a training run of 20 rounds.
The table shows how long a round takes on Java 25, in milliseconds. For the rows with several rounds, it is the mean per round:
| Rounds | without a cache | without profiles | with profiles |
|---|---|---|---|
| 1 | 501 | 399 | 372 |
| 2 to 5 | 133.2 | 131.0 | 112.8 |
| 11 to 20 | 67.3 | 67.4 | 61.9 |
| 21 to 30 | 64.3 | 64.4 | 60.3 |
| 31 to 40 | 59.8 | 59.9 | 61.0 |
| 81 to 100 | 53.8 | 54.1 | 56.9 |
During the warmup, the profiles deliver what the JEP promises: in rounds 2 to 5, a round takes 131.0 milliseconds without profiles and 112.8 ms with profiles – with profiles, it needs 13.9% less time. In rounds 11 to 20, too, the program is still faster with profiles.
After that, however, the picture changes. Compared with the program without a cache, a round with profiles needs:
- in rounds 21 to 30 still 6.2% less time (without a cache 64.3 ms, with profiles 60.3 ms),
- in rounds 31 to 40 already 2.0% more time (59.8 versus 61.0 ms),
- in rounds 81 to 100 5.7% more time (53.8 versus 56.9 ms).
The following chart shows all 100 rounds individually, as the median of each round. The blue line is the variant without a cache, the red one the variant without profiles, and the yellow one the variant with profiles. So that the late rounds can be told apart, the y-axis starts at 40 milliseconds and ends at 160: the first two rounds are therefore mostly above the upper edge.
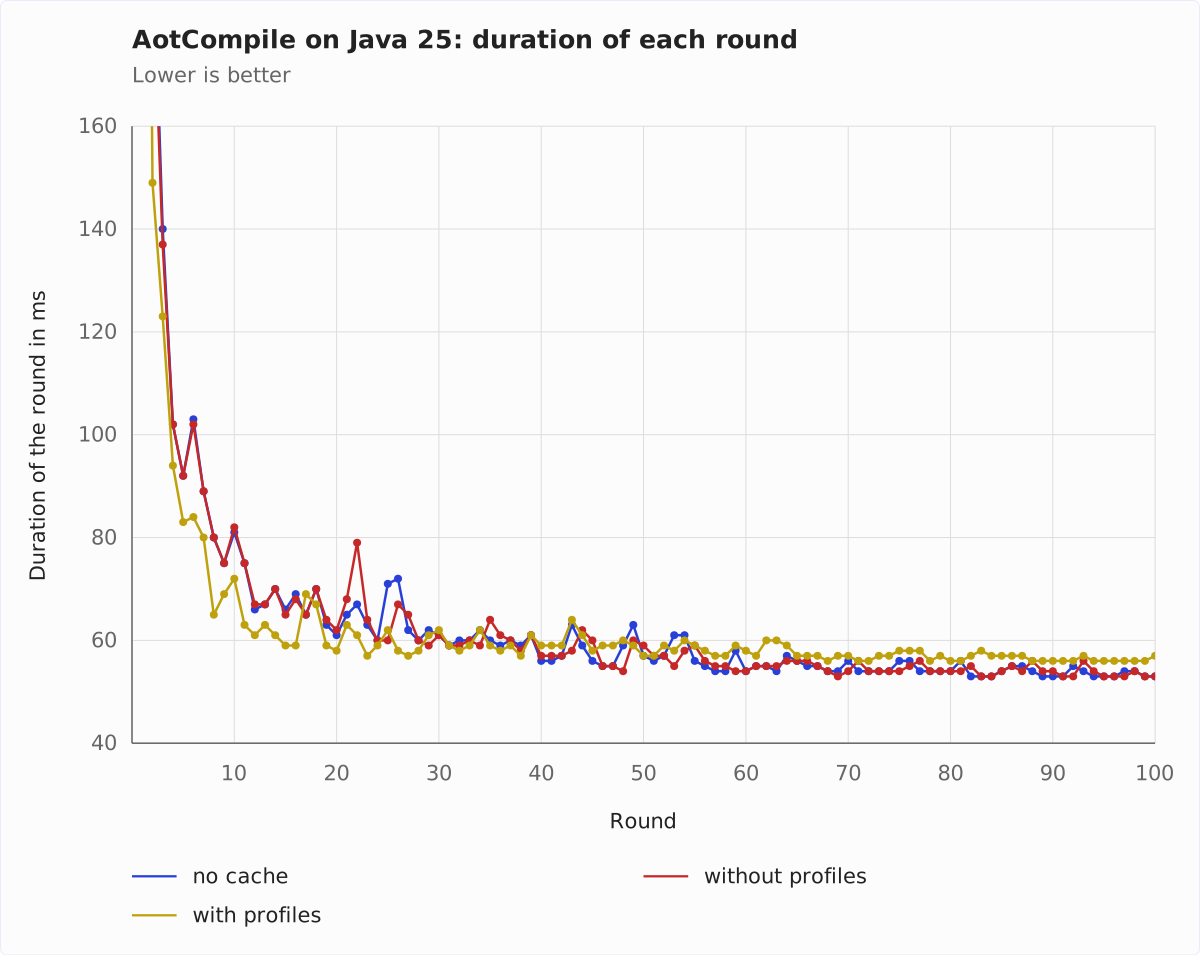
From round 2 on, the blue and the red line lie almost on top of each other: without profiles, the loaded and linked classes only give a head start in the first round. The yellow line lies below the blue and the red one until about round 30 – and above them after that.
What the JVM Does with the Profiles
Where does the head start in the warmup come from, and where does the lag after it come from? A look into the source code of HotSpot shows four mechanisms through which the profiles from the cache control the compilation:
- The profile from the training becomes the method’s profile. When HotSpot creates the profile of a method, it installs the profile from the cache instead of creating an empty one. At startup, all counters are at the state from the end of the training run.
- Methods that were compiled by C2 in the training skip the profiling. These methods go from level 0 via level 2 directly to level 4, without the profiling level 3. C2 compiles them with the profile from the training.
- Lukewarm methods wait. A method that was only compiled by C1 in the training stays at level 2 until it has been called more often in the production run than in the whole training run. This applies since Java 26. Java 25 does not yet compare with the counters from the training. It delays methods from the training across the board: it multiplies the threshold for leaving level 0 by 100 and the one for leaving level 2 by 250.
- Eager compilation (Java 28). When a class is initialized, the JVM queues the compilations of its methods from the training before these methods are called. This depends on the option
AOTCompileEagerly. In Java 25, it is off. Java 28 switches it on if the optionAOTCodeCachingis set when the AOT cache is opened. That option is on by default in the production run – even if the cache contains no AOT code at all.
Mechanisms 1 and 2 explain the head start in the warmup: C2 compiles the hot methods early and with a complete profile. Mechanism 4 explains why the first round becomes slower on Java 28, mechanism 3 why the program falls behind once more later – at the earliest when the production run has completed as many rounds as the training run. I show both in the next two sections. None of the four mechanisms explains the lasting lag – more on that shortly.
Java 28: A Slower First Round
On Java 28, the first round of AotCompile takes 490 milliseconds with profiles, and only 417 milliseconds without profiles – that is 17.5% more. In rounds 2 to 5, on the other hand, the program is faster with profiles: a round takes 147.5 milliseconds without profiles and 133.2 ms with profiles, i.e., 9.7% less. On Java 25, the first round is also faster with profiles, as the table in the section A Larger Example shows.
The reason is eager compilation: the JVM queues the methods from the training for compilation as soon as their class is initialized, before the program calls them. One run each with the option -XX:+LogCompilation, which logs every compile task with timestamps, shows this:
- In the first 0.25 seconds, the JVM with cached method profiles puts 3,468 tasks for level 2 into the queue. 3,073 of them are eager tasks, only 395 are for methods that the program has already called. These 395 tasks wait 562 milliseconds at the median and 614 milliseconds at the 90th percentile.
- Without cached profiles, the JVM queues 2,161 tasks for level 3 in the same time, all for methods that the program has already called. More than half of them get their turn within the same millisecond in which they were queued; the log has timestamps in whole milliseconds, which is why the median wait is 0. At the 90th percentile, a task waits 1 millisecond.
- C2 also gets eager tasks: of the 370 C2 tasks from the time between 0.25 and 0.5 seconds, 221 are eager with cached profiles. The remaining 149, for methods that have already been called, wait 534 milliseconds at the median. Without cached profiles, C2 tasks wait less than a millisecond during this time.
So the methods that the program needs right now wait in the queue behind the eager tasks – and until it is their turn, they run in the interpreter.
The many compilations do not slow the program down through CPU load: the program itself runs in a single thread, and the other 17 of my machine’s 18 processor cores are free for the 12 compiler threads of the JVM. The program becomes slower because the methods it needs right now are compiled later.
A counter-check with the option switched confirms this: -XX:+UnlockDiagnosticVMOptions -XX:-AOTCompileEagerly switches eager compilation off in Java 28, where it is on by default, and -XX:+UnlockExperimentalVMOptions -XX:+AOTCompileEagerly switches it on in Java 25, where it is off by default. The table shows the first round and the means of rounds 2 to 5 and 6 to 10, in milliseconds:
| without profiles | with profiles, without eager compilation | with profiles, with eager compilation | |
|---|---|---|---|
| Java 28, round 1 | 417 | 405 (switched) | 491 |
| Java 28, rounds 2 to 5 | 144.8 | 128.8 (switched) | 133.8 |
| Java 28, rounds 6 to 10 | 86.4 | 85.6 (switched) | 77.8 |
| Java 25, round 1 | 398 | 372 | 500 (switched) |
| Java 25, rounds 2 to 5 | 129.0 | 112.0 | 97.2 (switched) |
| Java 25, rounds 6 to 10 | 84.4 | 73.6 | 70.4 (switched) |
Switching the option reverses, in both versions, whether the first round with profiles is shorter or longer than without profiles:
- On Java 28, the first round takes 491 milliseconds with eager compilation, longer than without profiles (417 ms). Without eager compilation, it takes 405 milliseconds, less than without profiles.
- On Java 25, the first round takes 500 milliseconds with eager compilation, longer than without profiles (398 ms). Without eager compilation, it takes 372 milliseconds, less than without profiles.
So eager compilation makes the first round slower and only later rounds faster: on Java 25 already rounds 2 to 5, on Java 28 only rounds 6 to 10. On Java 28, rounds 2 to 5 even take longer with eager compilation than without.
In this example, eager compilation does not make up for the lag from the first round in either version. Calculated from the values in the table, the first five rounds take in total:
- on Java 25 889 milliseconds with eager compilation, 820 ms without,
- on Java 28 1,026 milliseconds with eager compilation, 920 ms without.
Even after 20 rounds, the variant with eager compilation is still behind: on Java 25, the first 20 rounds take 1,858 milliseconds with eager compilation and 1,809 ms without, on Java 28 2,062 ms with and 2,006 ms without (median of the sums per run). Later, eager compilation is no longer faster even per round: in rounds 81 to 100, a round with eager compilation takes 58.2 instead of 57.3 milliseconds on Java 25, and 57.3 instead of 56.8 ms on Java 28.
The option AOTCompileEagerly is diagnostic in Java 28 and experimental in Java 25. I use it here as a measuring instrument; I do not recommend it for production.
The Delayed Warmup
Lukewarm methods – i.e., those that were only compiled by C1 in the training – stay at level 2 on Java 28 until the production run exceeds their call count from the training. After that, they catch up on their warmup: they move to the profiling level 3 and are then compiled by C2 with fresh profiles.
So when this delayed warmup happens depends on the length of the training run. The number of compilations at level 3, counted with -XX:+PrintCompilation, shows this:
- After 5 rounds of training, there are 926 level-3 compilations with a cache in the 5 following rounds, and only 349 without a cache.
- After 20 rounds of training, there are 392 level-3 compilations with a cache in the 5 following rounds, and only 49 without a cache.
- After 60 rounds of training, there are 148 level-3 compilations with a cache in the 10 following rounds, and 66 without a cache. Most of them only follow in rounds 81 to 90 here: 305 with a cache, 62 without.
That the compilations bunch up like this is due to the threshold for the level-3 compilations: on Java 28, it is each lukewarm method’s call count from the training. Because AotCompile compiles the same 50 source files in every round, many lukewarm methods reach this threshold in the same few rounds – at the earliest when the production run has completed as many rounds as the training run.
On Java 25, there is no such wave of level-3 compilations: with the cache from 20 rounds of training, there are no more than 86 in any of the round blocks. Java 25 does not delay lukewarm methods until their call count from the training, but until a fixed multiple of the usual threshold. Frequently called methods reach this threshold early, rarely called ones late – which is why the level-3 compilations spread over the whole run.
In the run times, the delayed warmup shows up on Java 28 as a step. The following chart shows 200 rounds without a cache and with the cache from 100 rounds of training. Each point is the mean of five rounds, each round the median of 10 runs:
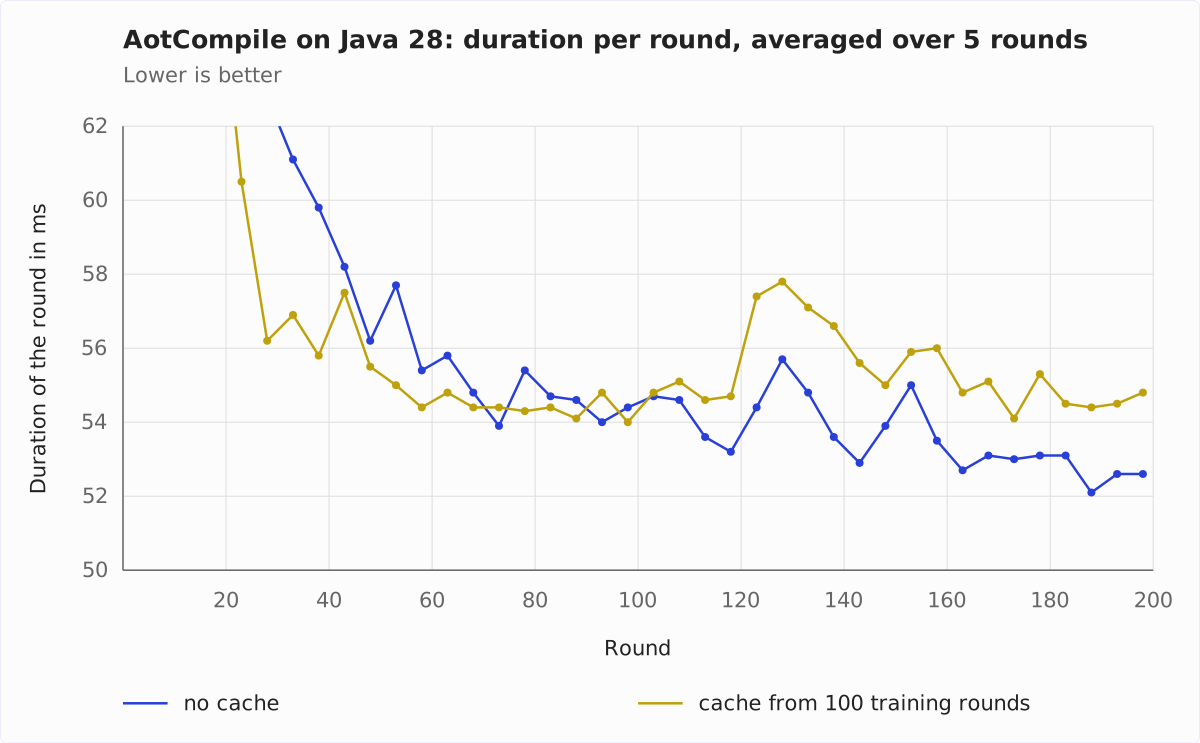
Until about round 60, the yellow line is below the blue one; with the cache, the program is faster there. From round 60 to round 120, both lines are about level; in rounds 101 to 120, a round with the cache takes 54.9 milliseconds on average, without a cache 54.1 ms. From round 121 on, the yellow line stays above the blue one: in rounds 121 to 140 at 57.5 versus 54.7 milliseconds, in rounds 181 to 200 still at 54.6 versus 52.7 ms. The spikes that both lines share, around round 125 and around round 155, do not come from the cache.
On Java 25, there is no wave, and there is no step either. The following chart shows the same measurement on Java 25, also with a cache from 100 rounds of training:
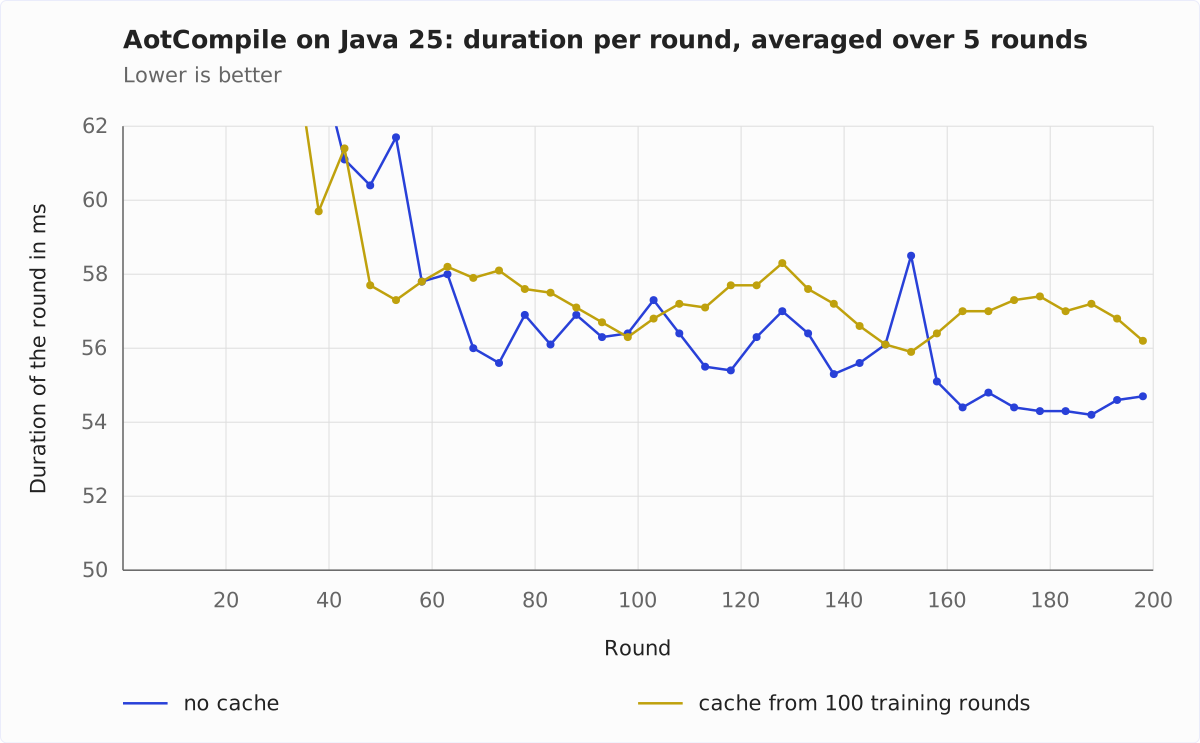
Here, the yellow line is above the blue one almost throughout from about round 60 on, without a jump at round 121: in rounds 61 to 80, a round with the cache takes 58.0 milliseconds on average, without a cache 56.7 ms, in rounds 121 to 140 then 57.8 versus 56.0 ms, and in rounds 181 to 200 finally 57.0 versus 54.6 ms. So on Java 25, too, the program becomes slower with the cache – only the lag sets in gradually instead of in a step. The next section shows why the program with the cache stays slower in the long run in both versions.
Why the Code Becomes Slower in the Long Run
That leaves the question of why AotCompile – the example program that compiles 50 source files with javac in each round – is slower in the long run with the profiles than without a cache.
From here on, it gets very technical – all the way down into the C++ source code of HotSpot. For practical purposes, one finding is enough: code that calls lambda expressions can currently run slower in the long run with the method profiles from the AOT cache than without method profiles, on Java 25 as on Java 28. If that is enough for you, you can skip directly to the section How Long Should the Training Run Be? If you want to know exactly why this is so, you are warmly invited to read on.
The Finding: Still Slower After 200 Rounds
Has the production run simply not run long enough? No. The table shows the mean of rounds 181 to 200 on Java 28, in milliseconds, for caches from three different training runs:
| Variant | Rounds 181 to 200 | compared with no cache |
|---|---|---|
| without a cache | 52.7 | – |
| with a cache from 20 rounds, without profiles | 53.0 | +0.6% |
| with a cache and profiles from 20 rounds | 55.4 | +5.1% |
| with a cache and profiles from 60 rounds | 55.6 | +5.5% |
| with a cache and profiles from 100 rounds | 54.6 | +3.6% |
All three caches with profiles stay slower. With 100 rounds of training, the program is still about level with the variant without a cache until round 100 – in rounds 81 to 100, a round takes 54.4 instead of 54.7 milliseconds – and only falls behind with the delayed warmup from round 121 on. So a longer training only shifts the point from which the program is slower.
A Small Example: AotLambda
In AotCompile, the difference is spread over hundreds of call sites in the code of javac – more on that in the section Back to AotCompile. That is why I reproduced the effect in a small program that calls a lambda expression in a loop:
import java.util.function.IntUnaryOperator;

void main(String[] args) throws InterruptedException {
  int rounds = args.length > 0 ? Integer.parseInt(args[0]) : 10;
  int factor = 31;
  int offset = 7;
  IntUnaryOperator op = x -> (x * factor + offset) ^ (x >>> 3);

  Steps.init();
  Thread.sleep(500); // gives the JVM time to compile Steps before its first call

  for (int i = 1; i <= rounds; i++) {
    long start = System.nanoTime();
    int sum = 0;
    for (int j = 0; j < 1_000; j++) {
      sum = Steps.run(op, sum);
    }
    long millis = (System.nanoTime() - start) / 1_000_000;
    IO.println("Iteration %2d: %4d ms (%d)".formatted(i, millis, sum));
  }
}

class Steps {
  static final int[] DATA = new int[100_000];

  static void init() {}

  static int run(IntUnaryOperator op, int sum) {
    int[] data = DATA;
    for (int i = 0; i < data.length; i++) {
      sum += step(op, data[i] + i);
    }
    return sum;
  }

  static int step(IntUnaryOperator op, int value) {
    return op.applyAsInt(value);
  }
}
In each round, the program calls Steps.run() 1,000 times. For each of the 100,000 elements of the array DATA, this method calls the lambda expression op via Steps.step(). The lambda expression uses the two local variables factor and offset; this makes its method applyAsInt() 13 bytes in size, and C2 only inlines it if it considers the call site frequent enough.
Two lines are needed for the effect: Steps.init() initializes the class Steps, and the half-second pause gives the JVM time to compile Steps from the profiles of the training before Steps.run() runs for the first time. Without the pause, the interpreter runs Steps.run() and Steps.step() first. It keeps counting in the profile from the cache and enters the lambda class and its calls again before C2 compiles the method – and the effect does not occur.
This is how you compile the program, package it into a JAR file, and create the cache with a training run of five rounds:
javac -d classes AotLambda.java
jar cf AotLambda.jar -C classes .
java -XX:AOTCacheOutput=AotLambda.aot -cp AotLambda.jar AotLambda 5
Without a cache, the program prints the following on Java 28:
java -cp AotLambda.jar AotLambda 10Iteration 1: 50 ms (-564873344)
Iteration 2: 27 ms (-564873344)
Iteration 3: 24 ms (-564873344)
Iteration 4: 23 ms (-564873344)
Iteration 5: 23 ms (-564873344)
Iteration 6: 23 ms (-564873344)
Iteration 7: 23 ms (-564873344)
Iteration 8: 23 ms (-564873344)
Iteration 9: 23 ms (-564873344)
Iteration 10: 23 ms (-564873344)With the cache, the output looks like this:
java -XX:AOTCache=AotLambda.aot -cp AotLambda.jar AotLambda 10Iteration 1: 128 ms (-564873344)
Iteration 2: 87 ms (-564873344)
Iteration 3: 87 ms (-564873344)
Iteration 4: 87 ms (-564873344)
Iteration 5: 87 ms (-564873344)
Iteration 6: 87 ms (-564873344)
Iteration 7: 87 ms (-564873344)
Iteration 8: 87 ms (-564873344)
Iteration 9: 87 ms (-564873344)
Iteration 10: 87 ms (-564873344)With the cache, each round takes almost four times as long as without a cache, and that does not change even after ten rounds. If you start the program with the same cache and -XX:-AOTReplayTraining, i.e., without the profiles, it is as fast as without a cache: from round 4 on, each round then takes 23 milliseconds.
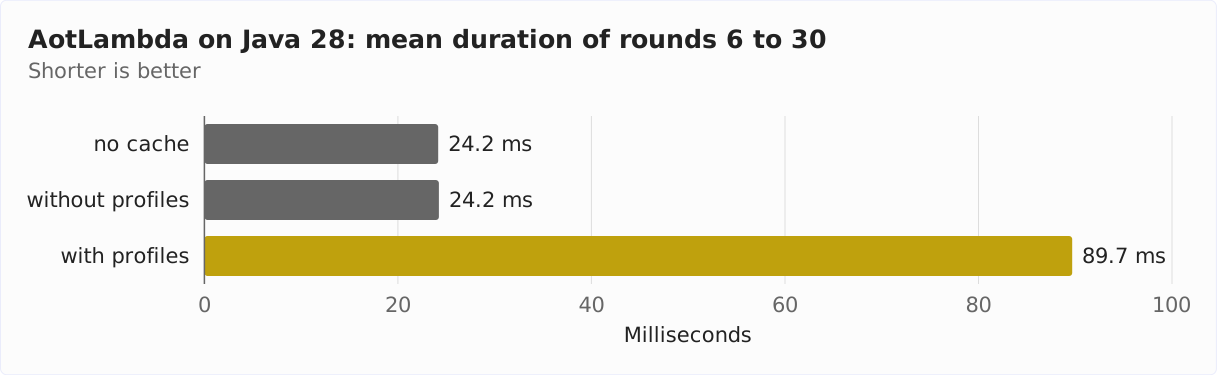
On Java 28, the cache also contains AOT code. Without AOT code, the result is the same. The table shows the mean of rounds 6 to 30 from a measurement series with caches without AOT code, in milliseconds:
| without a cache | without profiles | with profiles | |
|---|---|---|---|
| Java 25 | 24.0 | 24.0 | 90.9 |
| Java 28 | 24.2 | 24.2 | 89.7 |
With profiles, the program is 3.8 times as slow as without on Java 25 and 3.7 times as slow on Java 28.
The option -XX:+PrintInlining, which prints for each compilation which calls C2 inlines and which it does not, shows the reason. The following command filters out the lines for the call of applyAsInt(), first without the profiles:
java -XX:+UnlockDiagnosticVMOptions -XX:-AOTReplayTraining \
     -XX:AOTCache=AotLambda.aot -XX:+PrintInlining -cp AotLambda.jar AotLambda 10 \
     | grep -oE "applyAsInt.*(inline \(hot\)|to inline: [a-z ]+)"
applyAsInt (13 bytes) inline (hot)
applyAsInt (13 bytes) inline (hot)
applyAsInt (13 bytes) inline (hot)Without the profiles, C2 inlines the lambda expression in all three compilations that contain the call site. With the profiles, the output of the same command without -XX:-AOTReplayTraining looks like this:
applyAsInt (13 bytes) failed to inline: low call site frequencyC2 considers the call site to be rarely called and does not inline the lambda expression. This leaves one method call via the interface IntUnaryOperator per element of the array. Because the lambda expression itself consists of only a few instructions, this call weighs heavily.
Yet the call site ran very often during the training. The source code of the JVM shows why C2 nevertheless considers it rare – after the following info box, in the section The Mechanism in the Source Code.
The Mechanism in the Source Code
I found the reason in the source code of JDK 28, in four steps:
- The lambda class is excluded. For each lambda expression, the JVM generates a hidden class at run time. At the end of the training run, the JVM writes a preliminary stage of the cache, the so-called AOT configuration. It only includes hidden classes there if an archivable constant pool entry or an archived object refers to them (
AOTArtifactFinder::find_artifacts()inaotArtifactFinder.cpp). The references of the resolved lambda call sites, however, are only archived by the second step of the cache creation, the so-called assembly phase. So every lambda class counts as an “Unreferenced hidden class” here and is excluded. - Its rows disappear from the profiles – along with the counter. Immediately afterwards, the JVM removes all excluded classes from the profiles (
TrainingData::cleanup_training_data()). At a call site likeop.applyAsInt()inSteps.step(), the profile stores one row with a counter per receiver class.ReceiverTypeData::clear_row()inmethodData.cppdeletes the row of the lambda class and also resets the counter of the call site to 0. - C2 considers the call site cold. C2 calculates the frequency of a call site from its counter and the number of calls of the method according to the profile (
InlineTree::should_not_inline()inbytecodeInfo.cpp). The method counter is at the state of the training, the counter of the call site at 0. Result: “low call site frequency”. - The production run does not repair this. If the JVM compiles the method from the profiles of the training before the interpreter has profiled it in the production run, the counter stays at 0. At level 2, the C1 code does not collect any profile data.
ReceiverTypeData::clear_row() resets the counter to 0 on purpose. The comment in the source code justifies this with unloaded classes: if a class has been unloaded, the program phase has changed, and the old counter no longer means anything. When the AOT configuration is written, however, no class has been unloaded – the call site was hot, only its receiver class does not get into this preliminary stage of the cache.
In the assembly phase, the JVM generates the lambda classes anew and archives them. By then, however, their profile rows have already been deleted.
When the AOT configuration is written, the methods of the lambda classes also lose their own training data entirely (MethodTrainingData::cleanup() in trainingData.cpp).
The option -Xlog:aot+training=debug makes the deletion visible during the training run:
java -Xlog:aot+training=debug::none -XX:AOTCacheOutput=AotLambda.aot \
     -cp AotLambda.jar AotLambda 5 | grep 'AotLambda\$\$'
Cleanup KTD AotLambda$$Lambda+0x800000001
Purged AotLambda$$Lambda+0x800000001 from MDO: excluded classIn HotSpot, “MDO” is the abbreviation for the method profile, an object of the class MethodData. This deletion has existed since JEP 515, i.e., since Java 25 – with a cache from Java 25, AotLambda is just as slow.
Back to AotCompile
For the cache for AotCompile from 20 rounds of training, -Xlog:aot+training=debug lists 445 deleted profile rows, 444 of them for lambda classes. In addition, 448 methods lose their training data entirely.
A comparison of C2’s inlining decisions with and without the profiles, call site by call site, shows the consequences. For this, I evaluated one run each with -XX:+LogCompilation with the script compare-inlining.py from the repository:
- C2 inlines 342 call sites only without the profiles. 157 of them lead through lambda, method handle, or string concatenation classes, i.e., through classes that the JVM generates at run time. 134 of these 157 call sites have the counter 0 or no counter at all with profiles.
- C2 inlines 324 call sites only with the profiles. Only a single one of them leads through such a class.
The most frequent reason why C2 does not inline with the profiles is “low call site frequency” – at 154 of the 342 call sites.
The hardware counters of the CPU show the result – the table shows them for the application thread, per round, determined from the last two seconds of a run over 100 rounds:
| Variant | Cycles | Instructions | Instructions per cycle |
|---|---|---|---|
| without a cache | 240.2 M | 1,037.8 M | 4.315 |
| without profiles | 241.6 M | 1,040.9 M | 4.310 |
| with profiles | 249.9 M | 1,065.3 M | 4.266 |
With profiles, javac executes 2.3% more instructions per round than without profiles, and the instructions per cycle drop by 1.0%. Together, a round needs 3.4% more cycles. I cannot measure directly how much of this is due to the deleted lambda rows alone, because no option switches off the deletion.
How Long Should the Training Run Be?
On Java 28, the following holds: the longer the training run, the more methods the JVM compiles eagerly, and the slower the first round becomes. Java 25 does not compile eagerly by default; that is why the following measurement only ran on Java 28. The table shows the first round and the means of rounds 2 to 5 and 81 to 100 in milliseconds, as well as the duration of the training run and cache creation and the size of the cache:
| Variant | Round 1 | Rounds 2 to 5 | Rounds 81 to 100 | Training and cache | Cache size |
|---|---|---|---|---|---|
| without a cache | 525 | 149.5 | 54.0 | – | – |
| with a cache from 20 rounds, without profiles | 417 | 147.5 | 54.6 | 3.7 s | 38.2 MB |
| with a cache and profiles from 5 rounds | 415 | 113.8 | 57.3 | 2.2 s | 36.2 MB |
| with a cache and profiles from 20 rounds | 490 | 133.2 | 57.0 | 3.7 s | 38.2 MB |
| with a cache and profiles from 60 rounds | 536 | 136.5 | 57.5 | 6.3 s | 39.5 MB |
| with a cache and profiles from 100 rounds | 596 | 132.8 | 54.5 | 8.5 s | 39.8 MB |
With five rounds of training, the first round is fastest; with 100 rounds of training, on the other hand, it is slower than without any cache. At level 2, the JVM compiles 4,397 methods in the first round after five rounds of training, and 5,493 methods after 100 rounds.
In rounds 81 to 100, the caches with profiles from 5, 20, and 60 rounds are 3.0 to 3.5 milliseconds behind the run without a cache. Only the cache from 100 rounds of training is still about level – but not because it is faster in the long run: its delayed warmup only comes from round 121 on, after which it falls behind too, as the chart in the section The Delayed Warmup shows.
For Java 28, I therefore recommend a short training if startup is what matters to you: it speeds up the first rounds the most. A longer training, on the other hand, costs more time when creating the cache and mainly shifts the point of the delayed warmup. With AOT code, the calculation looks different; the numbers for that are in the article Ahead-of-Time Code Compilation.
Iterative Training in Java 28
Since build 28-ea+23, a training run may load an existing AOT cache (JDK-8353598). It then starts like a production run with the profiles from the cache and keeps counting in them. At the end, it writes these updated profiles into its AOT configuration.
It also merges what both training runs recorded about which method was compiled at which level. If a method was compiled at different levels in the two runs, the higher one counts: if it was compiled only by C1 in the first run and by C2 in the second, the production run treats it like a method that was compiled by C2 during training.
This way, you can build a cache from several training runs:
java -XX:AOTCache=AotLambda.aot -XX:AOTCacheOutput=AotLambda-2.aot \
     -cp AotLambda.jar AotLambda 5
The output confirms in this line that the JVM does both:
Reading AOTCache AotLambda.aot and writing AOTConfiguration AotLambda-2.aot.configYou might expect iterative training to solve the problem with the lambda expressions: in the first training run, the JVM excludes the lambda classes because it generated them at run time and no archivable reference points to them. In the second training run, on the other hand, they already come from the cache – so they and their profile rows should be kept.
That is only half true: the lambda class does come from the cache – -Xlog:class+load reports “source: shared objects file” for it.
But this training run, too, only writes an AOT configuration, and the same rule as above applies there: if no archivable reference points to a lambda class, the JVM excludes it from the AOT configuration – even if it comes from the cache. -Xlog:aot=debug reports “Unreferenced hidden class” again, and -Xlog:aot+training=debug reports the deleted profile row right after it.
Accordingly, iterative training does not change the run times. With a cache from five rounds of training, a round of AotLambda takes 88.5 milliseconds, with a cache from five more rounds on top of it also 88.5 milliseconds – without a cache 24.0 ms.
AotCompile behaves the same way: even with iterative training, the program stays slower than without a cache, and it is not faster than with a single training run. The table shows the mean of rounds 81 to 100 in milliseconds:
| Variant | Rounds 81 to 100 | compared with no cache |
|---|---|---|
| without a cache | 54.9 | – |
| with a cache from 20 rounds, without profiles | 55.2 | +0.5% |
| with a cache and profiles from 20 rounds | 57.8 | +5.3% |
| with a cache and profiles from 20 rounds and 20 more iteratively | 58.3 | +6.2% |
| with a cache and profiles from 40 rounds in one go | 57.0 | +3.8% |
With iterative training, a round takes 0.9% longer than with a single training run of 20 rounds and 2.3% longer than with 40 rounds in one go.
The second training run, too, deletes 412 profile rows of lambda classes; in the first, it was 445.
What This Means in Practice
Two programs do not allow a verdict on all applications. Three things, however, do follow:
- For the warmup, the profiles deliver what the JEP promises, for startup only on Java 25. On Java 25, the first round of the example program takes 399 milliseconds without profiles and 372 ms with profiles, i.e., 6.8% less, and rounds 2 to 5 even need 13.9% less time with profiles – without you having to do anything for it. On Java 28, on the other hand, the first round is slower with the profiles because the JVM compiles eagerly; rounds 2 to 5 are faster there as well.
- In the long run, the profiles can cost performance, namely where hot code calls lambda expressions. Neither a longer nor an iterative training gets around this, and neither does the AOT code from Java 28, because the JVM compiles it from the same profiles.
- You can measure whether your application is affected. Start it with the same cache once without any further option and once with
-XX:-AOTReplayTraining, and compare the throughput once it is warm. Keep in mind that in Java 28 the option also switches off the AOT code.
I recommend using the AOT cache with profiles when startup and warmup matter – for example, for short-lived processes or services that are restarted frequently. For applications that run for days, the variant without profiles was faster in the long run in both of my examples. This is due to the deletion of the lambda profile rows when the cache is written, i.e., to a behavior of the current versions, not to the profiles as such. If this deletion is fixed in Java 28 or a later version, the disadvantage will probably disappear. But you should measure long-running applications even then: if they are only as fast with profiles as without, or barely faster, the effort for the training run and cache creation may not be worth it.
Conclusion
Since Java 25, the training run puts the method profiles into the AOT cache, and the C2 compiler uses them to compile the hot methods right after startup. In an example program that compiles 50 source files with javac in each round, on Java 25 the first round takes 399 milliseconds without profiles and 372 ms with profiles, i.e., 6.8% less. One of rounds 2 to 5 takes 131.0 ms without profiles and 112.8 ms with profiles, i.e., 13.9% less.
On Java 28, on the other hand, the first round is slower with profiles than without, because the JVM compiles the methods from the training eagerly: 490 instead of 417 milliseconds with a cache from 20 rounds of training, i.e., 17.5% more.
In the long run, the program is slower with the profiles than without a cache – on Java 28 by 5.1% after 200 rounds with a cache from 20 rounds of training. The reason: when writing the AOT configuration – the preliminary stage of the cache at the end of the training run – the JVM deletes the lambda classes from the profiles, along with the counter of the call site, and C2 then no longer inlines these lambda expressions. In a small example, this makes the program almost four times as slow.
Measure the throughput of your application after the warmup with and without profiles before you decide on a cache with profiles. A longer or iterative training does not change anything about the deletion of the lambda classes from the profiles.
If this article has helped you, I would greatly appreciate a positive review on my ProvenExpert profile. Your feedback helps me improve my content and motivates me to write new informative articles.